


步骤说明:
1、组织所需数据及相关算法编写;
所需数据:中心点(经纬度),圆的起始角度,圆的半径
算法编写:计算出半径外所有的点,然后组合成几何图形(风圈形状)
直接上代码演示:
<html>
<head>
    <meta charset="utf-8" />
    <meta
            name="viewport"
            content="initial-scale=1,maximum-scale=1,user-scalable=no"
    />

    <!--
  ArcGIS API for JavaScript, https://js.arcgis.com
  For more information about the featurereduction-cluster-filter-slider sample, read the original sample description at developers.arcgis.com.
  https://developers.arcgis.com/javascript/latest/sample-code/featurereduction-cluster-filter-slider/index.html
  -->
    <title>
        Point clustering - advanced configuration | Sample | ArcGIS API for
        JavaScript 4.18
    </title>

    <link
            rel="stylesheet"
            href="https://js.arcgis.com/4.18/esri/themes/dark/main.css"
    />
    <script src="https://js.arcgis.com/4.18/"></script>

    <style>
        html,
        body,
        #viewDiv {
            height: 100%;
            width: 100%;
            margin: 0;
            padding: 0;
        }
        #infoDiv {
            padding: 10px;
            width: 275px;
        }
        #sliderValue {
            font-weight: bolder;
        }
        #legendDiv {
            width: 260px;
        }
        #description {
            padding: 10px 0 10px 0;
        }
    </style>

    <script>
        require([
            "esri/Map",
            "esri/views/MapView",
            "esri/Graphic"
        ], function (Map, MapView,Graphic) {
            const map = new Map({
                basemap: {
                    portalItem: {
                        id: "8d91bd39e873417ea21673e0fee87604"
                    }
                }
            });
            const view = new MapView({
                container: "viewDiv",
                map: map,
                center: [128.261567, 45.052645],  // Sets center point of view using longitude,latitude
                zoom:9,
            });
            var polygon = {
                type: "polygon", // autocasts as new Polygon()
                rings: getPoints(lngLatToXY([128.261567, 45.052645]))
            };
            // Create a symbol for rendering the graphic
            var fillSymbol = {
                type: "simple-fill", // autocasts as new SimpleFillSymbol()
                color: [227, 139, 79, 0.6],
                outline: {
                    // autocasts as new SimpleLineSymbol()
                    color: [255, 255, 255],
                    width: 1
                }
            };
            // Add the geometry and symbol to a new graphic
            var polygonGraphic1 = new Graphic({
                geometry: polygon,
                symbol: fillSymbol
            });
            view.graphics.addMany([polygonGraphic1]);
            function getPoints(center) {//获得组成风圈的点(平面坐标)
                var points=[];
                var cradius=[200,180,140,100];
                for(var j=0;j<4;j++){
                    var radius = cradius[j] * 1000;//转换为米
                    var pointNum = 90;
                    var endAngle = j*90 + 90;
                    var sin;
                    var cos;
                    var x;
                    var y;
                    var angle;
                    for (var i = 0; i <= pointNum; i++) {
                        angle = j*90 + (endAngle - j*90) * i
                            / pointNum;
                        sin = Math.sin(angle * Math.PI / 180);
                        cos = Math.cos(angle * Math.PI / 180);

                        x = center[0] + radius * sin;
                        y = center[1] + radius * cos;

                        points.push(mercator2lonlat([x, y]));
                    }
                }

                return points;
            }
            function getPointsO(center, cradius, startAngle) {//获得组成风圈的点(平面坐标)
                var radius = cradius * 1000;//转换为米
                var pointNum = 90;
                var endAngle = startAngle + 90;

                var sin;
                var cos;
                var x;
                var y;
                var angle;

                for (var i = 0; i <= pointNum; i++) {
                    angle = startAngle + (endAngle - startAngle) * i
                        / pointNum;
                    sin = Math.sin(angle * Math.PI / 180);
                    cos = Math.cos(angle * Math.PI / 180);

                    x = center[0] + radius * sin;
                    y = center[1] + radius * cos;

                    points.push([x, y]);
                }
            }
            function lngLatToXY(pt){//经纬度转化为平面坐标
                var _f = 6378137, _p = 0.017453292519943;
                var lng = pt[0];//经度
                var lat = pt[1];//纬度

                if (lat > 89.999999){
                    lat = 89.999999;
                }
                else if (lat < -89.999999){
                    lat = -89.999999;
                }
                var c = lat * _p;
                x = lng * _p * _f;
                y = _f / 2 * Math.log((1 + Math.sin(c)) / (1 - Math.sin(c)));

                return [x,y];
            }
            //经纬度转墨卡托
            function lonlat2mercator(lonlat){
                var mercator=[];
                var x = lonlat[0] *20037508.34/180;
                var y = Math.log(Math.tan((90+lonlat[1])*Math.PI/360))/(Math.PI/180);
                y = y *20037508.34/180;
                mercator.push(x);
                mercator.push(y);
                return mercator ;
            }

            //墨卡托转经纬度
            function mercator2lonlat(mercator){
                var lonlat=[];
                var x = mercator[0]/20037508.34*180;
                var y = mercator[1]/20037508.34*180;
                y= 180/Math.PI*(2*Math.atan(Math.exp(y*Math.PI/180))-Math.PI/2);
                lonlat.push(x);
                lonlat.push(y);
                return lonlat;
            }
        });
    </script>
</head>

<body>
<div id="viewDiv"></div>
<div id="infoDiv" class="esri-widget">
    <div id="description">
        Show power plants with at least
        <span id="sliderValue">0</span> megawatts of capacity
    </div>
    <div id="sliderContainer">
        <div id="sliderDiv"></div>
    </div>
    <div id="legendDiv"></div>
</div>
</body>
</html>
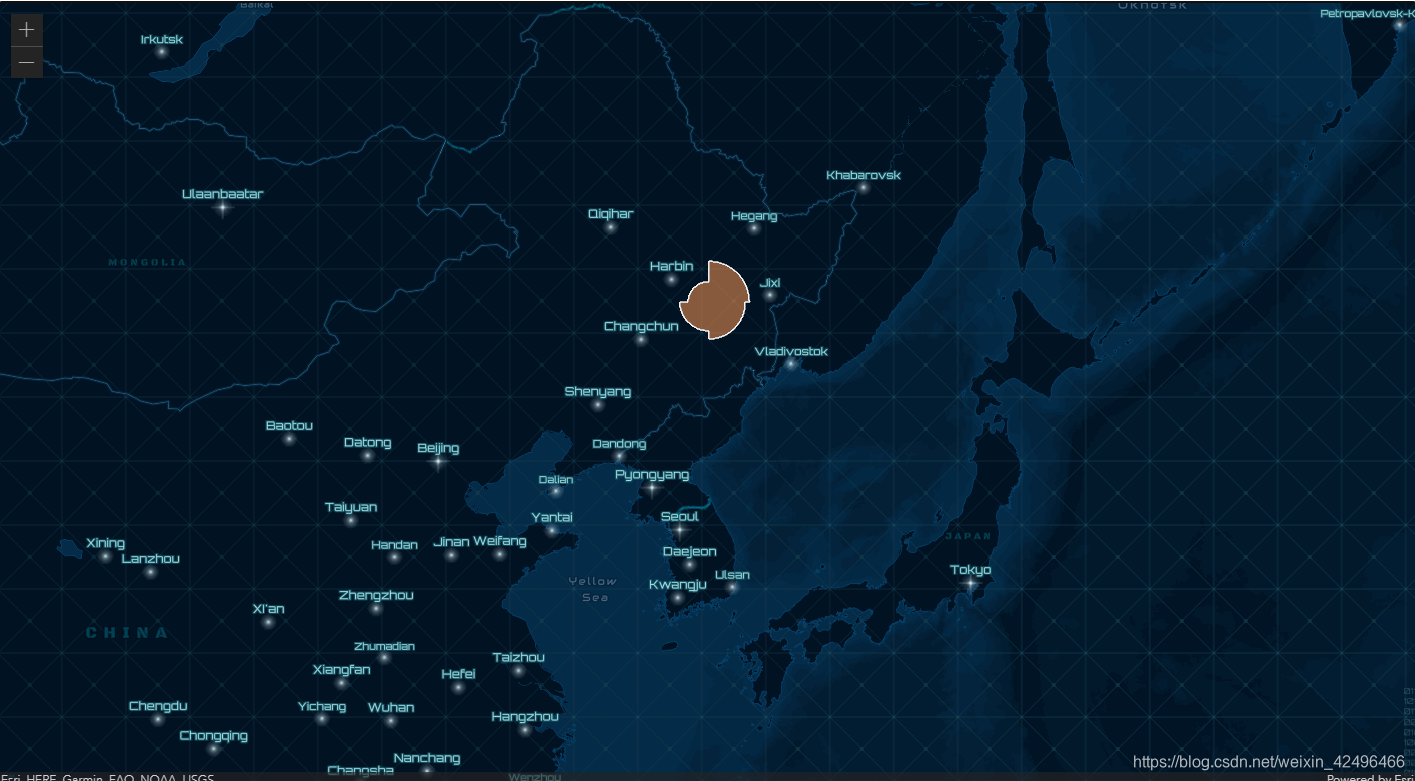
演示效果:
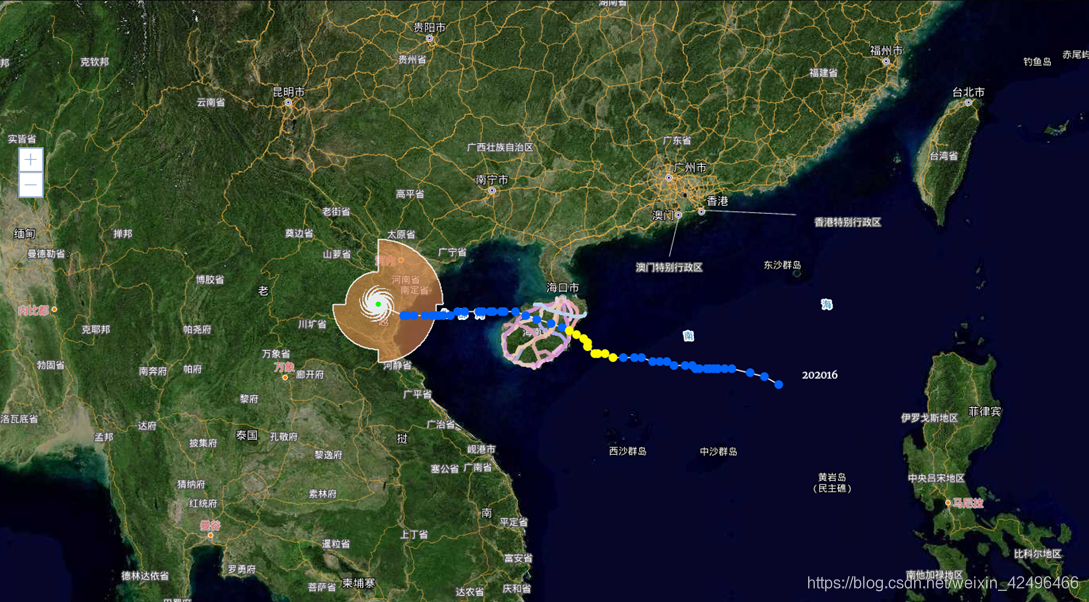
台风应用效果展示:
感谢支持技术分享,请扫码点赞支持:
技术合作交流qq:2401315930


 3596
3596

 被折叠的 条评论
为什么被折叠?
被折叠的 条评论
为什么被折叠?
 到【灌水乐园】发言


