


最近在用Taro写一个小程序,有一些数据统计,需要使用到echarts,今天就来说说它的使用方法。
首先我们需要看看需求:
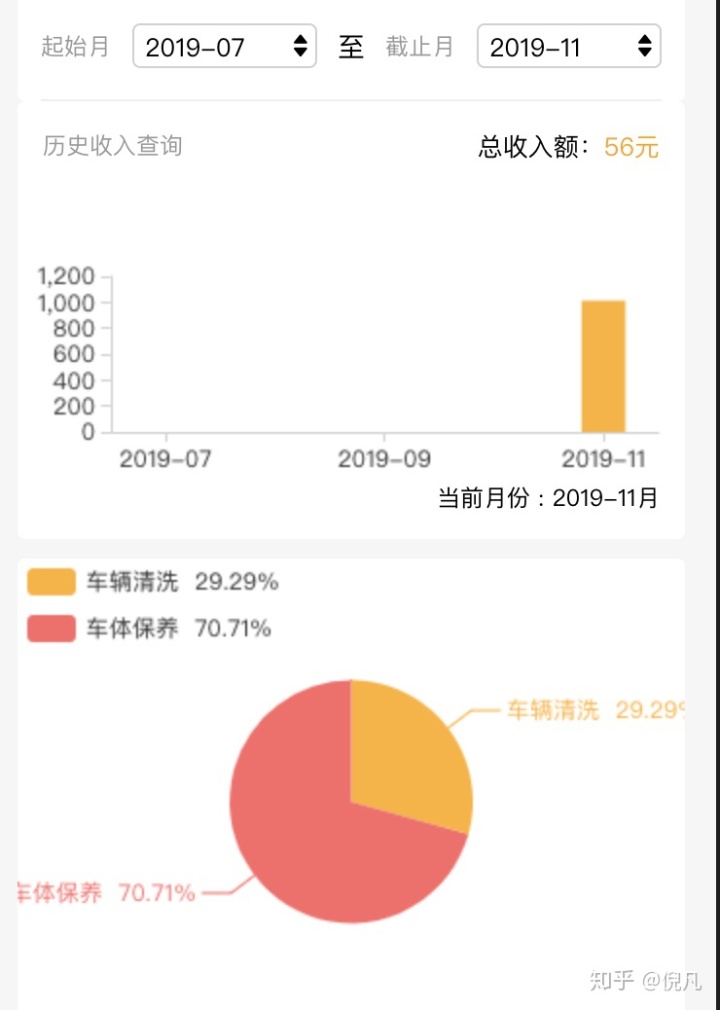
我们需要选择日期,确定显示的月份,然后会展示对应月份的柱形图,当我们点击对应月份时,下面的扇形图会展示对应的详情,所以我们会用到 echarts的点击事件。
首先我们需要下载echarts,然后引入它: import * as echarts from '../ec-canvas/echarts'
然后需要注册组件:
config = {

    usingComponents: {

      'ec-canvas': '../ec-canvas/ec-canvas'
    }
  }
然后我们在需要画图的地方定义好需要的图:
<ec-canvas
    ref={this.refHistoryHipperChart}
    canvas-id="mychart-history-hipper"
    ec={ec}
    />
<ec-canvas
    ref={this.refHistoryRollChart}
    canvas-id="mychart-history-roll"
    ec={ec}
    />
这分别对应柱形图,和扇形图。ref分别时我们需要获取对应节点的函数:
refHistoryHipperChart = (node) => (this.HistoryHipperChart = node)

  refHistoryRollChart = (node) => (this.HistoryRollChart = node)
分别存到实例中,方便使用,然后就是渲染函数:
refreshHistoryHipperChart(names, data) {

    let _this = this,
      clickTime
    this.HistoryHipperChart.init((canvas, width, height) => {

      const chart = echarts.init(canvas, null, {

        width: width,
        height: height
      })
      setChartData(chart, data)

      chart.getZr().on('click', ()
最低0.47元/天 解锁文章


 4183
4183


 被折叠的 条评论
为什么被折叠?
被折叠的 条评论
为什么被折叠?
 到【灌水乐园】发言


