


 本教程介绍了如何使用OpenCV的line(), ellipse(), rectangle(), circle()和fillPoly()函数在Python中绘制线条、椭圆、矩形、圆和填充多边形。内容包括函数用法、参数解释以及示例代码。"
108797391,7352261,HDL与FPGA实战指南,"['FPGA开发', 'Verilog语言', 'HDL设计', '数字系统设计', 'FPGA教程']
本教程介绍了如何使用OpenCV的line(), ellipse(), rectangle(), circle()和fillPoly()函数在Python中绘制线条、椭圆、矩形、圆和填充多边形。内容包括函数用法、参数解释以及示例代码。"
108797391,7352261,HDL与FPGA实战指南,"['FPGA开发', 'Verilog语言', 'HDL设计', '数字系统设计', 'FPGA教程']
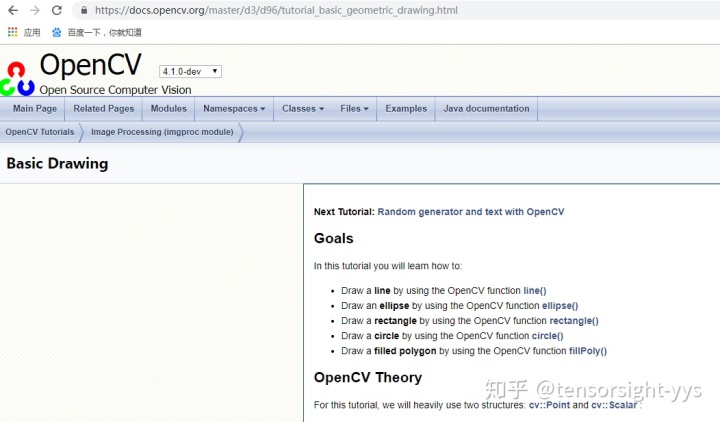
opencv更新挺快的,已经到了4.0,得及时的系统学习。
OpenCV: Basic Drawingdocs.opencv.org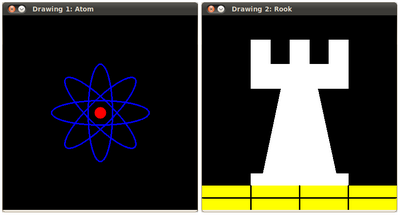
Goals
In this tutorial you will learn how to:
- Draw a line by using the OpenCV function line()
- Draw an ellipse by using the OpenCV function ellipse()
- Draw a rectangle by using the OpenCV function rectangle()
- Draw a circle by using the OpenCV function circle()
- Draw a filled polygon by using the OpenCV function fillPoly()
目标
在本教程中,您将学习如何:
- 画一条线,通过使用OpenCV的 line()函数,
- 绘制一个椭圆,通过使用OpenCV的 ellipse()函数
- 绘制一个矩形,通过使用OpenCV的 rectangle()函数
- 画一个圆,通过使用OpenCV的 circle()函数
- 绘制填充多边形,通过使用OpenCV的 fillPoly()函数
Code
- This code is in your OpenCV sample folder. Otherwise you can grab it from here
- 此代码位于OpenCV示例文件夹中。要不然你可以从这里抓到代码
import cv2 as cv
import numpy as np
W = 400
def my_ellipse(img, angle):
    thickness = 2
    line_type = 8
    cv.ellipse(img,
                (W / 2, W / 2),
                (W / 4, W / 16),
                angle,
                0,
                360,
                (255, 0, 0),
                thickness,
                line_type)
def my_filled_circle(img, center):
    thickness = -1
    line_type = 8
    cv.circle(img,
               center,
               W / 32,
               (0, 0, 255),
               thickness,
               line_type)
def my_polygon(img):
    line_type = 8
    # Create some points
    ppt = np.array([[W / 4, 7 * W / 8], [3 * W / 4, 7 * W / 8],
                    [3 * W / 4, 13 * W / 16], [11 * W / 16, 13 * W / 16],
                    [19 * W / 32, 3 * W / 8], [3 * W / 4, 3 * W / 8],
                    [3 * W / 4, W / 8], [26 * W / 40, W / 8],
                    [26 * W / 40, W / 4], [22 * W / 40, W / 4],
                    [22 * W / 40, W / 8], [18 * W / 40, W / 8],
                    [18 * W / 40, W / 4], [14 * W / 40, W / 4],
                    [14 * W / 40, W / 8], [W / 4, W / 8],
                    [W / 4, 3 * W / 8], [13 * W / 32, 3 * W / 8],
                    [5 * W / 16, 13 * W / 16], [W / 4, 13 * W / 16]], np.int32)
    ppt = ppt.reshape((-1, 1, 2))
    cv.fillPoly(img, [ppt], (255, 255, 255), line_type)
    # Only drawind the lines would be:
    # cv.polylines(img, [ppt], True, (255, 0, 255), line_type)
def my_line(img, start, end):
    thickness = 2
    line_type = 8
    cv.line(img,
             start,
             end,
             (0, 0, 0),
             thickness,
             line_type)
atom_window = "Drawing 1: Atom"
rook_window = "Drawing 2: Rook"
# Create black empty images
size = W, W, 3
atom_image = np.zeros(size, dtype=np.uint8)
rook_image = np.zeros(size, dtype=np.uint8)
# 1.a. Creating ellipses
my_ellipse(atom_image, 90)
my_ellipse(atom_image, 0)
my_ellipse(atom_image, 45)
my_ellipse(atom_image, -45)
# 1.b. Creating circles
my_filled_circle(atom_image, (W / 2, W / 2))
# 2. Draw a rook
# ------------------
# 2.a. Create a convex polygon
my_polygon(rook_image)
cv.rectangle(rook_image,
              (0, 7 * W / 8),
              (W, W),
              (0, 255, 255),
              -1,
              8)
#  2.c. Create a few lines
my_line(rook_image, (0, 15 * W / 16), (W, 15 * W / 16))
my_line(rook_image, (W / 4, 7 * W / 8), (W / 4, W))
my_line(rook_image, (W / 2, 7 * W / 8), (W / 2, W))
my_line(rook_image, (3 * W / 4, 7 * W / 8), (3 * W / 4, W))
cv.imshow(atom_window, atom_image)
cv.moveWindow(atom_window, 0, 200)
cv.imshow(rook_window, rook_image)
cv.moveWindow(rook_window, W, 200)
cv.waitKey(0)
cv.destroyAllWindows()
Explanation
Since we plan to draw two examples (an atom and a rook), we have to create two images and two windows to display them.
说明
由于我们计划绘制两个例子(一个原子和一个车),我们必须创建两个图像和两个窗口来显示它们。
# Windows names
atom_window = "Drawing 1: Atom"
rook_window = "Drawing 2: Rook"
# Create black empty images
size = W, W, 3
atom_image = np.zeros(size, dtype=np.uint8)
rook_image = np.zeros(size, dtype=np.uint8)
We created functions to draw different geometric shapes. For instance, to draw the atom we used MyEllipse and MyFilledCircle:
我们创建了绘制不同几何形状的函数。例如,要绘制原子,我们使用 MyEllipse 和 MyFilledCircle:
 MyEllipse( atom_image, 90 );
 MyEllipse( atom_image, 0 );
 MyEllipse( atom_image, 45 );
 MyEllipse( atom_image, -45 );
 MyFilledCircle( atom_image, Point( w/2, w/2) );
And to draw the rook we employed MyLine, rectangle and a MyPolygon:
并画一个车,使用 MyLine, rectangle and a MyPolygo 函数:
# 2. Draw a rook
# ------------------
# 2.a. Create a convex polygon
my_polygon(rook_image)
cv.rectangle(rook_image,
              (0, 7 * W / 8),
              (W, W),
              (0, 255, 255),
              -1,
              8)
#  2.c. Create a few lines
my_line(rook_image, (0, 15 * W / 16), (W, 15 * W / 16))
my_line(rook_image, (W / 4, 7 * W / 8), (W / 4, W))
my_line(rook_image, (W / 2, 7 * W / 8), (W / 2, W))
my_line(rook_image, (3 * W / 4, 7 * W / 8), (3 * W / 4, W))
Let's check what is inside each of these functions:
让我们检查每个函数内部的内容:
MyLine
def my_line(img, start, end):
    thickness = 2
    line_type = 8
    cv.line(img,
             start,
             end,
             (0, 0, 0),
             thickness,
             line_type)
As we can see,MyLine just call the function line(), which does the following:
- Draw a line from Point start to Point end
- The line is displayed in the image img
- The line color is defined by ( 0, 0, 0 ) which is the RGB value correspondent to Black
- The line thickness is set to thickness (in this case 2)
- The line is a 8-connected one (lineType = 8)
MyLine()函数
我们可以看到,MyLine 只调用函数line(),它执行以下操作:
- 从起点到终点画一条线
- 该线显示在图像img中
- 线颜色通过(0,0,0)定义,它是对应黑色的RGB值
- 线条粗细设置为厚度(本例子中是2)
- 该线是一个8连接的(lineType = 8)
MyEllipse
def my_ellipse(img, angle):
    thickness = 2
    line_type = 8
    cv.ellipse(img,
                (W / 2, W / 2),
                (W / 4, W / 16),
                angle,
                0,
                360,
                (255, 0, 0),
                thickness,
                line_type)
From the code above, we can observe that the function ellipse() draws an ellipse such that:
- The ellipse is displayed in the image img
- The ellipse center is located in the point (w/2, w/2) and is enclosed in a box of size (w/4, w/16)
- The ellipse is rotated angle degrees
- The ellipse extends an arc between 0 and 360 degrees
- The color of the figure will be ( 255, 0, 0 ) which means blue in BGR value.
- The ellipse's thickness is 2.
MyEllipse()函数
从上面的代码中,我们可以观察到函数ellipse()绘制一个椭圆,结果如下:
- 椭圆显示在图像img中
- 椭圆中心位于点(w / 2,w / 2),并被封装在一个大小为(w / 4,w / 16)的盒子中
- 椭圆旋转angle个角度
- 椭圆在0到360度之间延伸弧形
- 图的颜色将是(255,0,0),即蓝色的BGR值。
- 椭圆的厚度为2。
MyFilledCircle
def my_filled_circle(img, center):
    thickness = -1
    line_type = 8
    cv.circle(img,
               center,
               W / 32,
               (0, 0, 255),
               thickness,
               line_type)
Similar to the ellipse function, we can observe that circle receives as arguments:
- The image where the circle will be displayed (img)
- The center of the circle denoted as the point center
- The radius of the circle: w/32
- The color of the circle: ( 0, 0, 255 ) which means Red in BGR
- Since thickness = -1, the circle will be drawn filled.
MyFilledCircle()函数
与椭圆函数类似,我们可以观察到圆圈 作为参数接收:
- 将显示圆圈的图像(img)
- 圆心表示为点中心
- 圆的半径:w / 32
- 圆的颜色:(0,0,255),即红色的BGR中值
- 由于厚度 = -1,因此将绘制圆圈将被填充。
MyPolygon
def my_polygon(img):
    line_type = 8
    # Create some points
    ppt = np.array([[W / 4, 7 * W / 8], [3 * W / 4, 7 * W / 8],
                    [3 * W / 4, 13 * W / 16], [11 * W / 16, 13 * W / 16],
                    [19 * W / 32, 3 * W / 8], [3 * W / 4, 3 * W / 8],
                    [3 * W / 4, W / 8], [26 * W / 40, W / 8],
                    [26 * W / 40, W / 4], [22 * W / 40, W / 4],
                    [22 * W / 40, W / 8], [18 * W / 40, W / 8],
                    [18 * W / 40, W / 4], [14 * W / 40, W / 4],
                    [14 * W / 40, W / 8], [W / 4, W / 8],
                    [W / 4, 3 * W / 8], [13 * W / 32, 3 * W / 8],
                    [5 * W / 16, 13 * W / 16], [W / 4, 13 * W / 16]], np.int32)
    ppt = ppt.reshape((-1, 1, 2))
    cv.fillPoly(img, [ppt], (255, 255, 255), line_type)
    # Only drawind the lines would be:
    # cv.polylines(img, [ppt], True, (255, 0, 255), line_type)
To draw a filled polygon we use the function fillPoly(). We note that:
- The polygon will be drawn on img
- The vertices of the polygon are the set of points in ppt
- The color of the polygon is defined by ( 255, 255, 255 ), which is the BGR value for white
MyPolygon()函数
要绘制填充多边形,我们使用fillPoly()函数。我们注意到:
- 多边形将在img上绘制
- 多边形的顶点是ppt中的点集
- 多边形的颜色由(255,255,255)定义,这是白色的BGR值
rectangle
 rectangle( rook_image,
         Point( 0, 7*w/8 ),
         Point( w, w),
         Scalar( 0, 255, 255 ),
         FILLED,
         LINE_8 );
Finally we have the cv::rectangle function (we did not create a special function for this guy). We note that:
- The rectangle will be drawn on rook_image
- Two opposite vertices of the rectangle are defined by ( 0, 7*w/8 ) and ( w, w )
- The color of the rectangle is given by ( 0, 255, 255 ) which is the BGR value for yellow
- Since the thickness value is given by FILLED (-1), the rectangle will be filled.
最后我们有了rectangle函数(我们没有为这个创建一个特殊的函数)。我们注意到:
- 矩形将在rook_image上绘制
- 矩形的两个相对顶点由(0,7 * w / 8)和(w,w)定义
- 矩形的颜色由(0,255,255)给出,它是黄色的BGR值
- 由于厚度值由FILLED(-1)给出,因此矩形将被填充。
Result
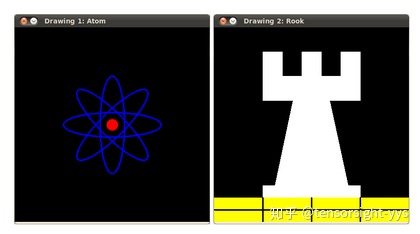
Compiling and running your program should give you a result like this:
结果
编译和运行程序应该给你一个这样的结果:
# -*- coding:utf-8 -*-
#yys
#本教程是cv2版本 4.1.0,同样适用于本机安装的版本是3.4.4
import cv2 as cv
import numpy as np
import sys
print(cv.__version__) #3.4.4

W = 400
def my_ellipse(img, angle):
    thickness = 2
    line_type = 8
    cv.ellipse(img,(int(W / 2),int(W / 2) ),(int(W / 4), int(W / 16)),angle,0,360,(255, 0, 0),thickness,line_type)
    return img

def my_filled_circle(img, center):
    thickness = -1
    line_type = 8
    cv.circle(img,center,int(W / 32),(0, 0, 255),thickness,line_type)
    return img
def my_polygon(img):
    line_type = 8
    # Create some points
    ppt = np.array([[W / 4, 7 * W / 8], [3 * W / 4, 7 * W / 8],[3 * W / 4, 13 * W / 16], [11 * W / 16, 13 * W / 16],
                    [19 * W / 32, 3 * W / 8], [3 * W / 4, 3 * W / 8],[3 * W / 4, W / 8], [26 * W / 40, W / 8],
                    [26 * W / 40, W / 4], [22 * W / 40, W / 4],[22 * W / 40, W / 8], [18 * W / 40, W / 8],
                    [18 * W / 40, W / 4], [14 * W / 40, W / 4],[14 * W / 40, W / 8], [W / 4, W / 8],
                    [W / 4, 3 * W / 8], [13 * W / 32, 3 * W / 8],[5 * W / 16, 13 * W / 16], [W / 4, 13 * W / 16]], np.int32)
    ppt = ppt.reshape((-1, 1, 2))
    cv.fillPoly(img, [ppt], (255, 255, 255), line_type)
    # Only drawind the lines would be:
    # cv.polylines(img, [ppt], True, (255, 0, 255), line_type)

def my_line(img, start, end):
    thickness = 2
    line_type = 8
    cv.line(img,start,end,(255, 0, 0),thickness,line_type)

atom_window = "Drawing 1: Atom"
rook_window = "Drawing 2: Rook"

# Create black empty images
size = W, W, 3
atom_image = np.zeros(size, dtype=np.uint8)#atom原子、微量
rook_image = np.zeros(size, dtype=np.uint8)#rook(国际象棋中的)车
cv.imshow(atom_window,atom_image)
cv.imshow(rook_window ,rook_image)

# 1.a. Creating ellipses  椭圆
atom_image_90=atom_image.copy()
img_90=my_ellipse(atom_image_90, 90)
cv.imshow("img_90", img_90)

atom_image_0=atom_image.copy()
img_0=my_ellipse(atom_image_0, 0)
cv.imshow("img_0", img_0)

atom_image_45=atom_image.copy()
img_45=my_ellipse(atom_image_45, 45)
cv.imshow("img_45", img_45)

atom_image_45_=atom_image.copy()
img_45_=my_ellipse(atom_image_45_, -45)
cv.imshow("img_-45", img_45_)
cv.waitKey(0)


# 1.b. Creating circles
atom_image_circles=atom_image.copy()
circles_image=my_filled_circle(atom_image_circles, (int(W / 2),int(W / 2) ) )
cv.imshow("circles_image",circles_image)
cv.waitKey(0)


# 2. Draw a rook
# ------------------

# 2.a. Create a convex polygon  #创建凸多边形
rook_polygon=rook_image.copy()
my_polygon(rook_polygon)
cv.rectangle(rook_polygon,(0, int(7 * W / 8) ),(W, W),(0, 255, 255),-1,8)
cv.imshow("rook_polygon",rook_polygon)
cv.waitKey(0)

#  2.c. Create a few lines
rook_lines=rook_image.copy()
my_line(rook_lines, ( 0, int(15 * W / 16) ), (W, int( 15 * W / 16) ) )
my_line(rook_lines, ( int(W / 4), int(7 * W / 8) ), ( int(W / 4), W))
my_line(rook_lines, ( int(W / 2), int(7 * W / 8) ), ( int(W / 2), W))
my_line(rook_lines, ( int(3 * W / 4), int(7 * W / 8) ), ( int(3 * W / 4), W))
cv.imshow("rook_lines", rook_lines)
# 将显示窗口移到显示屏的相应位置
cv.moveWindow("rook_lines", 0, 200)
cv.waitKey(0)
cv.destroyAllWindows()
####
note:
注意:数据类型应该是int类型(精度是像素,对应的是整型),当用float时,就会报错。可以用int()函数进行强制转换。


 293
293

 被折叠的 条评论
为什么被折叠?
被折叠的 条评论
为什么被折叠?
 到【灌水乐园】发言


