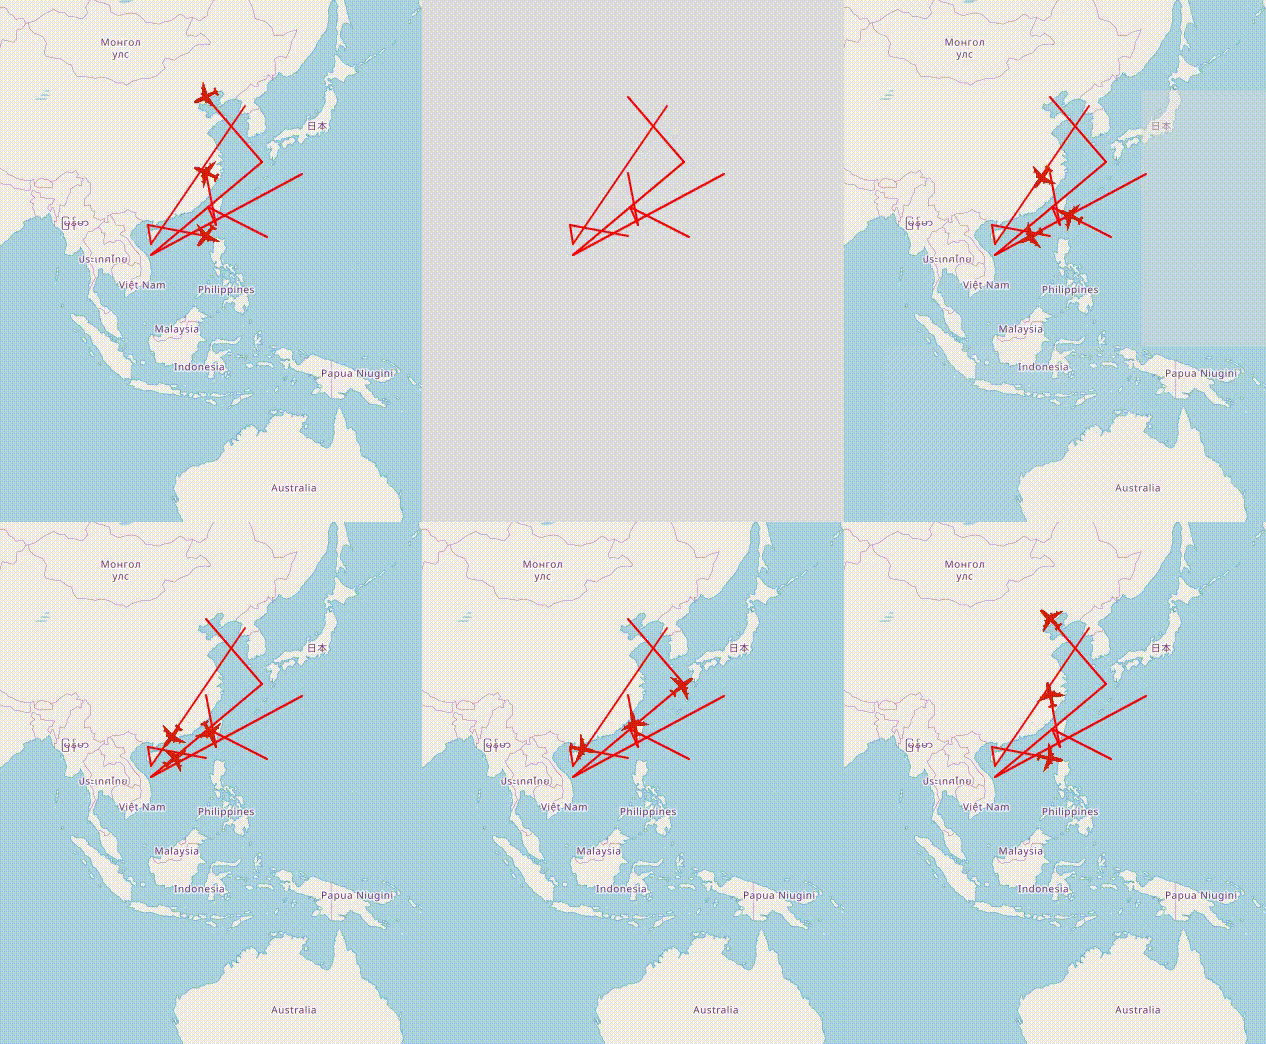
利用开源的leaflet结合天地图底图,做一条航线 可以在线上动态加载飞机icon,模仿飞机飞行状态
插件下载地址:https://download.csdn.net/download/weixin_42609477/11463900
先上效果图

首先将线画出来
function paintLine(A,B,C)
	{
		var obj,color,weight;
		obj = color = weight = null;
		obj = A;
		color = B;
		weight = C;
		if(obj == null){
			console.log("无数据可供绘制!");
			return;
		}
		if(color == null)	color = "red";
		if(weight == null)	weight = 2;

		for(var i=0;i<obj.length-1;++i)
		{
			var roil = [L.latLng(obj[i][0],obj[i][1]),L.latLng(obj[i+1][0],obj[i+1][1])];
			L.polyline(roil, { color: color, weight: weight }).addTo(map);
		}
	}
引用js
(function() {
    // save these original methods before they are overwritten
    var proto_initIcon = L.Marker.prototype._initIcon;
    var proto_setPos = L.Marker.prototype._setPos;

    var oldIE = (L.DomUtil.TRANSFORM === 'msTransform');

    L.Marker.addInitHook(function () {
        var iconOptions = this.options.icon && this.options.icon.options;
        var iconAnchor = iconOptions && this.options.icon.options.iconAnchor;
        if (iconAnchor) {
            iconAnchor = (iconAnchor[0] + 'px ' + iconAnchor[1] + 'px');
        }
        this.options.rotationOrigin = this.options.rotationOrigin || iconAnchor || 'center center' ;//设置旋转中心
        this.options.rotationAngle = this.options.rotationAngle || 0;

        // Ensure marker keeps rotated during dragging
        this.on('drag', function(e) { e.target._applyRotation(); });
    });

    L.Marker.include({
        _initIcon: function() {
            proto_initIcon.call(this);
        },

        _setPos: function (pos) {
            proto_setPos.call(this, pos);
            this._applyRotation();
        },

        _applyRotation: function () {
            if(this.options.rotationAngle) {
                this._icon.style[L.DomUtil.TRANSFORM+'Origin'] = this.options.rotationOrigin;

                if(oldIE) {
                    // for IE 9, use the 2D rotation
                    this._icon.style[L.DomUtil.TRANSFORM] = 'rotate(' + this.options.rotationAngle + 'deg)';
                } else {
                    // for modern browsers, prefer the 3D accelerated version
                    this._icon.style[L.DomUtil.TRANSFORM] += ' rotateZ(' + this.options.rotationAngle + 'deg)';
                }
            }
        },
        //设置旋转角度
        setRotationAngle: function (px1, py1, px2, py2) {
            x = px2 - px1;
            y = py2 - py1;
            hypotenuse = Math.sqrt(Math.pow(x, 2) + Math.pow(y, 2));
            //斜边长度
            cos = x / hypotenuse;
            radian = Math.acos(cos);
            //求出弧度
            angle = 180 / (Math.PI / radian);
            //用弧度算出角度
            if (y < 0) {
                angle = -angle;
            } else if ((y == 0) && (x < 0)) {
                angle = 180;
            }
            this.options.rotationAngle = angle;
            this.update();
            return this;
        },

        setRotationOrigin: function(origin) {
            this.options.rotationOrigin = origin;
            this.update();
            return this;
        }
    });
})();
MovingMarker.js
L.interpolatePosition = function(p1, p2, duration, t) {
    var k = t/duration;
    k = (k > 0) ? k : 0;
    k = (k > 1) ? 1 : k;
    return L.latLng(p1.lat + k * (p2.lat - p1.lat),
        p1.lng + k * (p2.lng - p1.lng));
};

L.Marker.MovingMarker = L.Marker.extend({

    //state constants
    statics: {
        notStartedState: 0,
        endedState: 1,
        pausedState: 2,
        runState: 3
    },

    options: {
        autostart: true,
        loop: false,
    },

    initialize: function (latlngs, durations, options) {
        L.Marker.prototype.initialize.call(this, latlngs[0], options);

        this._latlngs = latlngs.map(function(e, index) {
            return L.latLng(e);
        });

        if (durations instanceof Array) {
            this._durations = durations;
        } else {
            this._durations = this._createDurations(this._latlngs, durations);
        }

        this._currentDuration = 0;
        this._currentIndex = 0;

        this._state = L.Marker.MovingMarker.notStartedState;
        this._startTime = 0;
        this._startTimeStamp = 0;  // timestamp given by requestAnimFrame
        this._pauseStartTime = 0;
        this._animId = 0;
        this._animRequested = false;
        this._currentLine = [];
        this._stations = {};
    },

    isRunning: function() {
        return this._state === L.Marker.MovingMarker.runState;
    },

    isEnded: function() {
        return this._state === L.Marker.MovingMarker.endedState;
    },

    isStarted: function() {
        return this._state !== L.Marker.MovingMarker.notStartedState;
    },

    isPaused: function() {
        return this._state === L.Marker.MovingMarker.pausedState;
    },

    start: function() {
        if (this.isRunning()) {
            return;
        }

        if (this.isPaused()) {
            this.resume();
        } else {
            this._loadLine(0);
            this._startAnimation();
            this.fire('start');
        }
    },

    resume: function() {
        if (! this.isPaused()) {
            return;
        }
        // update the current line
        this._currentLine[0] = this.getLatLng();
        this._currentDuration -= (this._pauseStartTime - this._startTime);
        this._startAnimation();
    },

    pause: function() {
        if (! this.isRunning()) {
            return;
        }

        this._pauseStartTime = Date.now();
        this._state = L.Marker.MovingMarker.pausedState;
        this._stopAnimation();
        this._updatePosition();
    },

    stop: function(elapsedTime) {
        if (this.isEnded()) {
            return;
        }

        this._stopAnimation();

        if (typeof(elapsedTime) === 'undefined') {
            // user call
            elapsedTime = 0;
            this._updatePosition();
        }

        this._state = L.Marker.MovingMarker.endedState;
        this.fire('end', {elapsedTime: elapsedTime});
    },

    addLatLng: function(latlng, duration) {
        this._latlngs.push(L.latLng(latlng));
        this._durations.push(duration);
    },

    moveTo: function(latlng, duration) {
        this._stopAnimation();
        this._latlngs = [this.getLatLng(), L.latLng(latlng)];
        this._durations = [duration];
        this._state = L.Marker.MovingMarker.notStartedState;
        this.start();
        this.options.loop = false;
    },

    addStation: function(pointIndex, duration) {
        if (pointIndex > this._latlngs.length - 2 || pointIndex < 1) {
            return;
        }
        this._stations[pointIndex] = duration;
    },

    onAdd: function (map) {
        L.Marker.prototype.onAdd.call(this, map);

        if (this.options.autostart && (! this.isStarted())) {
            this.start();
            return;
        }

        if (this.isRunning()) {
            this._resumeAnimation();
        }
    },

    onRemove: function(map) {
        L.Marker.prototype.onRemove.call(this, map);
        this._stopAnimation();
    },

    _createDurations: function (latlngs, duration) {
        var lastIndex = latlngs.length - 1;
        var distances = [];
        var totalDistance = 0;
        var distance = 0;

        // compute array of distances between points
        for (var i = 0; i < lastIndex; i++) {
            distance = latlngs[i + 1].distanceTo(latlngs[i]);
            distances.push(distance);
            totalDistance += distance;
        }

        var ratioDuration = duration / totalDistance;

        var durations = [];
        for (i = 0; i < distances.length; i++) {
            durations.push(distances[i] * ratioDuration);
        }

        return durations;
    },

    _startAnimation: function() {
        this._state = L.Marker.MovingMarker.runState;
		//requestAnimFrame:CSS方法动画循环
        this._animId = L.Util.requestAnimFrame(function(timestamp) {
            this._startTime = Date.now();
            this._startTimeStamp = timestamp;
            this._animate(timestamp);
        }, this, true);
        this._animRequested = true;
    },

    _resumeAnimation: function() {
        if (! this._animRequested) {
            this._animRequested = true;
            this._animId = L.Util.requestAnimFrame(function(timestamp) {
                this._animate(timestamp);
            }, this, true);
        }
    },

    _stopAnimation: function() {
添加动画
/*添加动画*/
		function addAnimation(A,marker,picture)
		{
			marker = L.Marker.movingMarker(A,2000, {autostart: true});
            var moveicon = L.icon({
                iconUrl: picture,
				iconSize: [30, 30]
			});
			marker.options.icon = moveicon;
			marker.options.rotationOrigin = "center center";//以图标中心点做旋转
			map.addLayer(marker );
		}


 2159
2159

 被折叠的 条评论
为什么被折叠?


