echarts仪表盘特殊样式

在这里插入图片描述


const drawChartOption = function (value, max) {
   const colorConfig = {
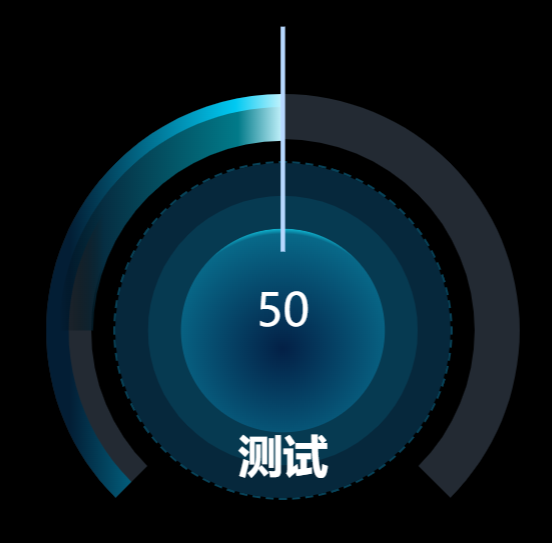
      name: '测试',
      colorList: {
         text: '#fff',
         line2: {
            type: 'linear',
            x: 0, // 右
            y: 0, // 下
            x2: 1, // 左
            y2: 0, // 上
            colorStops: [
              // {
              //     offset: 0,
              //     color: 'transparent'
              // },
                {
                  offset: 0.1,
                  color: '#031e35'
               },
               {
                  offset: 0.8,
                  color: '#00c9f2'
               },
               {
                  offset: 1,
                  color: '#c5f3fd'
               }
            ]
         },
         line3: {
            type: 'linear',
            x: 0, //右
            y: 0, //下
            x2: 1, //左
            y2: 0, //上
            colorStops: [
              {
                  offset: 0,
                  color: 'transparent'
              },
               {
                 offset:0.2,
                 color: '#062e42'
               },
               {
                  offset: 0.8,
                  color: '#017a89'
               },
               {
                  offset: 1,
                  color: '#c5f3fd'
               }
            ]
         }
      }
   }

   const ratio = max ? ((value / max) * 100).toFixed(1) : 0;

   const { name, colorList } = colorConfig;

   const option = {
      backgroundColor: '#000',
      tooltip: {
        show: false,
        formatter(params) {
            if (params) {
              const { marker, name } = params;
              // return `${marker}${name}  ${ratio ? ratio + '%' : ''}`;
              return ''
            } else {
              return '';
            }
        },
        triggerOn: 'mousemove',
        borderWidth: 0.5,
        color: '#ffffff'
      },
      grid: {
         left: '2%',
         right: '2%',
         bottom: '2%',
         top: '2%',
         containLabel: false
      },
      series: [
        
         //由外往内第二层线色部分
        {
            type: 'gauge',
            center: ['49.5%', '64%'],
            radius: '72%',
            // min: 0,
            // max: 100,
            zlevel: 6,
            pointer: {
              show: false //是否显示指针
            },
            tooltip: {
              show: true
            },
            progress: {
              show: true,
              roundCap: false,
              width: 20
            },
            title: {
              // 仪表盘标题。
              offsetCenter: [0, '55%'], // title圆环中心的距离
              fontSize: 40,
              fontWeight: 700,
              color:'#fff',
              
            },
            detail: {
              offsetCenter: [0, '-7%'], // title圆环中心的距离
              color: colorList.text,
              textAlign: 'center',
              fontSize: 40,
              fontWeight: 500,
              formatter: () => value
            },
            axisLabel: {
              // 刻度文字 如数字
              show: false,
            
            },
            axisTick: {
              show: false //是否显示刻度
            },
            axisLine: {
              roundCap: false,
              lineStyle: {
                  color: [[1, '#232A33']],
                  width: 40
              }
            },
            splitLine: {
              show: false //是否显示分隔线。
            },
            clockwise: true, //仪表盘刻度是否是顺时针增长。
            splitNumber: 1, //分割线之间的刻度
            // 起始点和最终点距离设置
            data: [
              {
                  name,
                  value: ratio,
                  itemStyle: {
                   
                    color: colorList.line2
                    
                  }
              }
            ]
        },
         //由外往内第三层渐变部分
        {
            type: 'gauge',
            radius: '68%',
            center: ['49.5%', '64%'],
            min: 0,
            max: 100,
            zlevel: 7,
           startAngle: 180,
           endAngle:0,
            pointer: {
              show: false //是否显示指针
            },
            progress: {
              show: true,
              roundCap: false,
              width: 30
            },
            title: {
              show: false
            },
            detail: {
              show: false
            },
            axisLabel: {
              show: false,
              // 刻度文字 如数字
              
            },
            axisTick: {
              show: false //是否显示刻度
            },
            axisLine: {
              show: false
            },
            emphasis: {
              scale: false
            },
            tooltip: {
              show: false
            },
            clockwise: true, //仪表盘刻度是否是顺时针增长。
            splitNumber: 1000, //分割线之间的刻度
            splitLine: {
              show: false
            },
            data: [
              {
                  name,
                  value: ratio,
                  itemStyle: {
                    color: colorList.line3
                  }
              }
            ]
        },
        // 指针
        {
            type: 'gauge',
            center: ['49.5%', '64%'],
            radius: '48%',
            min: 0,
            max: 100,
            zlevel: 8,
            startAngle: 180,
            endAngle: 0,
            detail: {
              show: false
            },
            axisLabel: {
              show: false
            },
            splitLine: {
              show: false
            },
            axisLine: {
              show: false
            },
            axisTick: {
              show: false
            },
            tooltip: {
              show: false
            },
            pointer: {
              show: true,
              length: 200,
              width: 4,
              icon: 'rect',
              offsetCenter: [0, '-50%'],
              itemStyle: {
                  color: '#B7D8FF'
              }
            },
            data: [ratio]
        },
        //虚线
       {
          title:'虚线',
          type: 'gauge',
          center: ['49.5%', '64%'],
          radius: '68%',
          min: 0,
          max: 100,
          splitNumber: 20,
          startAngle: 360,
          endAngle: 0,
          axisLine: {
              show: true,
              lineStyle: {
                  width: 40,
                  color: [
                      [1, 'rgba(0,0,0,0)']
                  ]
                  
              }
          },
          axisLabel: {
              show: false,
              color: '#4d5bd1',
              textStyle: {
                  fontWeight: 'bold',
                  fontSize: 18,
                  color: '#7789AA',
              },
              distance: 25,
              formatter: function (value) {
                  return value % 10 == 0 ? value : '';
              }
          },
          axisTick: {
              show: true,
              splitNumber: 4,
              lineStyle: {
                  color: '#074258',
                  width: 7,
              },
              length: -2
          },
          splitLine: {
              show: false,
          },
          detail: {
              show: false
          },
          pointer: {
              show: false
          }
      },
      {
          title:'园',
          type: 'gauge',
          center: ['49.5%', '64%'],
          radius: '51%',
          min: 0,
          max: 100,
          splitNumber: 20,
          startAngle: 360,
          endAngle: 0,
          axisLine: {
              show: true,
              lineStyle: {
                  width: 40,
                  color: [
                      [1, '#06283c']
                  ]
                  
              }
          },
          axisLabel: {
              show: false,
              
          },
          axisTick: {
              show: false,
              
          },
          splitLine: {
              show: false,
          },
          detail: {
              show: false
          },
          pointer: {
              show: false
          }
      },
      {
          title:'园',
          type: 'gauge',
          center: ['49.5%', '64%'],
          radius: '41%',
          min: 0,
          max: 100,
          splitNumber: 20,
          startAngle: 360,
          endAngle: 0,
          axisLine: {
              show: true,
              lineStyle: {
                  width: 40,
                  color: [
                      [1, '#063a51']
                  ]
                  
              }
          },
          axisLabel: {
              show: false,
              
          },
          axisTick: {
              show: false,
              
          },
          splitLine: {
              show: false,
          },
          detail: {
              show: false
          },
          pointer: {
              show: false
          }
      },
            {
          title:'园',
          type: 'gauge',
          center: ['49.5%', '64%'],
          radius: '31%',
          min: 0,
          max: 100,
          splitNumber: 20,
          startAngle: 360,
          endAngle: 0,
          axisLine: {
              show: true,
             lineStyle: {
                    color: [
                        [
                            1,
                            {
                                type: 'radial',
                                x: 0.5,
                                y: 0.59,
                                r: 0.6,
                                colorStops: [
                                    {
                                        offset: 0,
                                        color: '#032046',
                                    },
                                    {
                                        offset: 0.94,
                                        color: '#086989',
                                    },
                                    {
                                        offset: 0.98,
                                        color: '#0FAFCB',
                                    },
                                    {
                                        offset: 1,
                                        color: 'transparent',
                                    },
                                ],
                            },
                        ],
                    ],
                    width: 400,
                },
              
          },
          axisLabel: {
              show: false,
              
          },
          axisTick: {
              show: false,
              
          },
          splitLine: {
              show: false,
          },
          detail: {
              show: false
          },
          pointer: {
              show: false
          }
      },
      ]
   };

   return option;
};


const options = drawChartOption(50, 100)


option = options
  • 2
    点赞
  • 0
    收藏
    觉得还不错? 一键收藏
  • 0
    评论

“相关推荐”对你有帮助么?

  • 非常没帮助
  • 没帮助
  • 一般
  • 有帮助
  • 非常有帮助
提交
评论
添加红包

请填写红包祝福语或标题

红包个数最小为10个

红包金额最低5元

当前余额3.43前往充值 >
需支付:10.00
成就一亿技术人!
领取后你会自动成为博主和红包主的粉丝 规则
hope_wisdom
发出的红包
实付
使用余额支付
点击重新获取
扫码支付
钱包余额 0

抵扣说明:

1.余额是钱包充值的虚拟货币,按照1:1的比例进行支付金额的抵扣。
2.余额无法直接购买下载,可以购买VIP、付费专栏及课程。

余额充值