echart 自定义好看的仪表盘

在这里插入图片描述
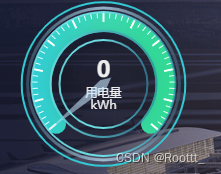
直接上图片,单纯显示数据,有个问题,无法显示指针百分比数,所以自己判断并赋了max值

 //代码不全,只显示赋值部分
 this.resultOption.series[1].data[0].value = val;
 this.resultOption.series[1].data[0].name = '用电量\nkWh';
 myChart.setOption(this.resultOption);
  if(val<100){
      this.resultOption.series[1].max = 100
  }
  if(val>100){
      this.resultOption.series[1].max = 1000
  }
  if(val>1000){
      this.resultOption.series[1].max = 10000
  }

//仪表盘全部配置代码

resultOption:{
    series: [
             // 外层
             {
                 type: 'gauge',
                 center: [
                     '50%',
                     '50%'
                 ],
                 radius: '92%', // 1行3个
                 min: 0,
                 max: 100,
                 startAngle: 270,
                 endAngle: -90,
                 axisLine: { // 坐标轴线
                     lineStyle: { // 属性lineStyle控制线条样式
                         width: 2,
                         color: [
                             [ 1,  '#0ac9d3' ],
                         ],
                     }
                 },
                 splitLine: {
                     show: false
                 },
                 axisLabel: {
                     show: false
                 },
                 axisTick: {
                     show: false
                 },
             },
             //(中间有背景颜色那块,刻度,数字 指针)
             {
                 type: 'gauge',
                 center: [
                     '50%',
                     '50%'
                 ],
                 radius: '80%', // 1行3个
                 splitNumber: 10,
                 min: 0,
                 max: 100,
                 startAngle: 220,
                 endAngle: -40,

                 //刻度样式
                 axisLine: {
                     show: true,
                     roundCap: true,
                     lineStyle: {
                         width: 20,
                         color: [
                             [
                                 1,
                                 new echarts.graphic.LinearGradient(
                                     0, 0, 1, 0, [
                                         {
                                             offset: 0,
                                             color: 'rgba(0, 205, 214, 1)',
                                         },
                                         {
                                             offset: 0.5,
                                             color: 'rgba(33, 215, 176, 1)',
                                         },
                                         {
                                             offset: 1,
                                             color:'rgba(0, 218, 143,1)',
                                         }
                                     ]
                                 )
                             ],
                         ]
                     }
                 },
                 axisLabel: {
                     show: false,
                     // distance: 20,
                     // textStyle: {
                     //     color:'#fff',
                     //     fontSize: '10',
                     // }
                 },
                 axisTick: {
                     distance:-20,
                     lineStyle: {
                         color:'#fff',
                         width: 1
                     },
                     length: 6,
                 },
                 splitLine: {
                     length: 10,
                     distance:-20,
                     lineStyle: {
                         color:'#fff',
                         width: 2
                     }
                 },
                 pointer: {
                     show: true,
                     length: '102%',
                     width: 5,
                 },
                 itemStyle:{
                     color: '#c3e5fc',
                     opacity: .6,
                 },
                 data: [{
                     value: 0,
                     name: '总能耗\nKWh',
                     title: {
                         offsetCenter: ['0%', '22%'],
                         fontSize: 12,
                         color:'#eee'
                     },
                     detail: {
                         offsetCenter: ['0%', '-18%'],
                         fontSize: 22,
                         color:'#eee'
                     }
                 }]
             },
             //(中间的线)
             {
                 type: 'gauge',
                 center: [
                     '50%',
                     '50%'
                 ],
                 radius: '81%',
                 startAngle: -90,
                 endAngle: 270,
                 axisLine: {
                     show: true,
                     lineStyle: {
                         width: 2,
                         color: [
                             [
                                 1,
                                 new echarts.graphic.LinearGradient(
                                     0, 0, 1, 0, [
                                         {
                                             offset: 0,
                                             color: 'rgba(96, 224, 230,.9)',
                                         },
                                         {
                                             offset: 0.5,
                                             color: 'rgba(96, 224, 230, 1)',
                                         },
                                         {
                                             offset: 1,
                                             color:'rgb(36, 140, 172,.7)',
                                         }
                                     ]
                                 )
                             ],
                         ]
                     }
                 },
                 splitLine: {
                     show: false,
                 },
                 //刻度数字
                 axisLabel: {
                     show: false,
                 },
                 //分隔线样式
                 axisTick: {
                     show: false
                 },

             },
             //二层白色线
             {
                 type: 'gauge',
                 center: [
                     '50%',
                     '50%'
                 ],
                 radius: '86%',
                 startAngle: 270,
                 endAngle: -90,
                 axisLine: {
                     show: true,
                     lineStyle: {
                         width: 3,
                         color: [
                             [
                                 1,
                                 new echarts.graphic.LinearGradient(
                                     0, 0, 1, 0, [
                                         {
                                             offset: 0,
                                             color:'rgba(61, 93, 115,.7)',
                                         },
                                         {
                                             offset: 0.5,
                                             color: 'rgba(177,211,233,0.8)',
                                         },
                                         {
                                             offset: 1,
                                             color:'rgba(61, 93, 115,.7)',
                                         }
                                     ]
                                 )
                             ],
                         ]
                     }
                 },
                 splitLine: {
                     show: false,
                 },
                 //刻度数字
                 axisLabel: {
                     show: false,
                 },
                 //分隔线样式
                 axisTick: {
                     show: false
                 },

             },
             //中间的线
             {
                 type: 'gauge',
                 center: [
                     '50%',
                     '50%'
                 ],
                 radius: '60%', // 1行3个
                 splitNumber: 10,
                 startAngle: -90,
                 endAngle: 270,
                 axisLine: { // 坐标轴线
                     lineStyle: { // 属性lineStyle控制线条样式
                         color: [
                             [
                                 1,
                                 new echarts.graphic.LinearGradient(
                                     0, 0, 1, 0, [
                                         {
                                             offset: 0,
                                             color: 'rgba(96, 224, 230, 1)',
                                         },
                                         {
                                             offset: 0,
                                             color: 'rgba(96, 224, 230, 1)',
                                         },
                                         {
                                             offset: 1,
                                             color:'rgb(36, 140, 172,.7)',
                                         }
                                     ]
                                 )
                             ],
                         ],
                         fontSize: 20,
                         width: 2,
                         opacity: 1, //刻度背景宽度
                     }
                 },
                 splitLine: {
                     show: false
                 },
                 axisLabel: {
                     show: false
                 },
                 pointer: {
                     show: false
                 },
                 axisTick: {
                     show: false
                 },
                 detail: {
                     show: 0
                 }
             },
             {
                 type: 'gauge',
                 center: [
                     '50%',
                     '50%'
                 ],
                 radius: '50%', // 1行3个
                 splitNumber: 10,
                 startAngle: -90,
                 endAngle: 270,
                 axisLine: { // 坐标轴线
                     lineStyle: { // 属性lineStyle控制线条样式、
                         color: [
                             [
                                 1,
                                 new echarts.graphic.LinearGradient(
                                     0, 0, 1, 0, [
                                         {
                                             offset: 0,
                                             color: 'rgba(96, 224, 230,.9)',
                                         },
                                         {
                                             offset: 0.5,
                                             color: 'rgba(96, 224, 230, 1)',
                                         },
                                         {
                                             offset: 1,
                                             color:'rgb(36, 140, 172,.7)',
                                         }
                                     ]
                                 )
                             ],
                         ],
                         width: 2,//刻度背景宽度
                         shadowBlur: 16,
                     }
                 },
                 textStyle:{
                     shadowBlur: 19,
                 },
                 splitLine: {
                     show: false
                 },
                 axisLabel: {
                     show: false
                 },
                 pointer: {
                     show: false
                 },
                 axisTick: {
                     show: false
                 },
                 detail: {
                     show: 0
                 }
             },
         ]
     },
  • 0
    点赞
  • 1
    收藏
    觉得还不错? 一键收藏
  • 0
    评论
评论
添加红包

请填写红包祝福语或标题

红包个数最小为10个

红包金额最低5元

当前余额3.43前往充值 >
需支付:10.00
成就一亿技术人!
领取后你会自动成为博主和红包主的粉丝 规则
hope_wisdom
发出的红包
实付
使用余额支付
点击重新获取
扫码支付
钱包余额 0

抵扣说明:

1.余额是钱包充值的虚拟货币,按照1:1的比例进行支付金额的抵扣。
2.余额无法直接购买下载,可以购买VIP、付费专栏及课程。

余额充值