


1.接这这样一个需求,刚看到设计图时,还以为是要用html+css画,后面提出要使用echarts来完成此设计。我:"!!! 难搞哦! 很有挑战性 不知道能不能完美实现 不管怎样先下手搞搞吧"。经过N+N小时的研究,把ehcharts文档摩擦了n遍,结合一些示例完成设计图,自己在这记录下。
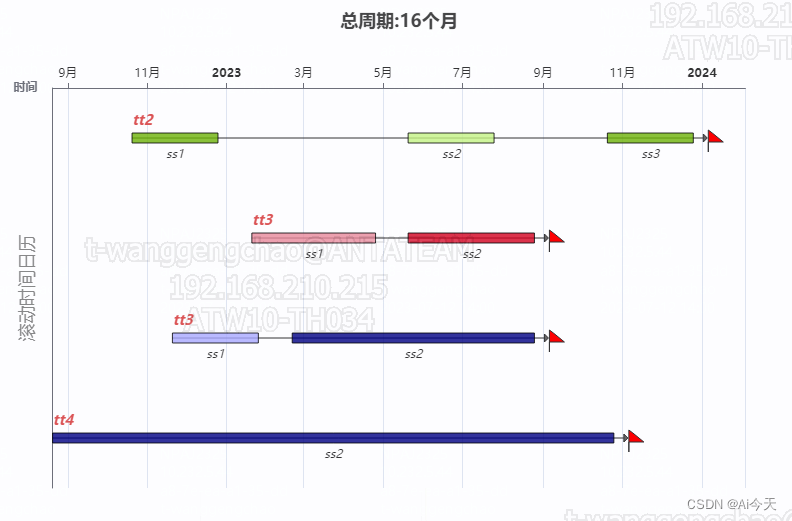
本案例使用的echarts 自定义功能实现
data:是要处理显示的
lineData:是根据data解析出用来画线、黑三角、小红旗的数据
代码:
var data = [];

data = [
  {
    name:'tt2',
    value:[0,new Date('2022-10-20').getTime(),new Date('2022-12-25').getTime(),'ss1'],
    itemStyle: {
      normal: {
        color:'#6eb407',
        borderColor: '#000',
        borderWidth: 1
      }
    }
  },
  {
    name:'tt2',
    value:[0,new Date('2023-05-20').getTime(),new Date('2023-07-25').getTime(),'ss2'],
    itemStyle: {
      normal: {
        color:'#c6f684',
        borderColor: '#000',
        borderWidth: 1
      }
    }
  },
  {
    name:'tt2',
    value:[0,new Date('2023-10-20').getTime(),new Date('2023-12-25').getTime(),'ss3'],
    itemStyle: {
      normal: {
        color:'#6eb407',
        borderColor: '#000',
        borderWidth: 1
      }
    }
  },
  {
    name:'tt3',
    value:[1,new Date('2023-01-20').getTime(),new Date('2023-04-25').getTime(),'ss1'],
    itemStyle: {
      normal: {
        color:'#ea8a9a',
        borderColor: '#000',
        borderWidth: 1
      }
    }
  },
  {
    name:'tt3',
    value:[1,new Date('2023-05-20').getTime(),new Date('2023-08-25').getTime(),'ss2'],
    itemStyle: {
      normal: {
        color:'#d5001f',
        borderColor: '#000',
        borderWidth: 1
      }
    }
  },
  {
    name:'tt3',
    value:[2,new Date('2022-11-20').getTime(),new Date('2023-01-25').getTime(),'ss1'],
    itemStyle: {
      normal: {
        color:'#a9a9ff',
        borderColor: '#000',
        borderWidth: 1
      }
    }
  },
  {
    name:'tt3',
    value:[2,new Date('2023-02-20').getTime(),new Date('2023-08-25').getTime(),'ss2'],
    itemStyle: {
      normal: {
        color:'#000082',
        borderColor: '#000',
        borderWidth: 1
      }
    }
  },
   {
    name:'tt4',
    value:[3,new Date('2022-08-20').getTime(),new Date('2023-10-25').getTime(),'ss2'],
    itemStyle: {
      normal: {
        color:'#000082',
        borderColor: '#000',
        borderWidth: 1
      }
    }
  }
]
console.log(data,'------数据格式----------')
let lineData = [];
let arrData = [];
data.forEach((f) => {
  const arr = f.value.filter((val) => typeof val == 'number');
  arr.shift();
  lineData[f.value[0]] = {
    name: f.name,
    value: lineData[f.value[0]] ? lineData[f.value[0]].value.concat(arr) : arr
  };
});
lineData.map((f, i) => {
  const d = f.value;
  f.value = [];
  f.value[0] = i;
  f.value[1] = Math.min(...d);
  f.value[2] = Math.max(...d);
  f.value[3] = f.name;
});
// console.log(lineData,'---lineData----',echarts)
function renderItem(params, api) {
  var categoryIndex = api.value(0);
  var start = api.coord([api.value(1), categoryIndex]);
  var end = api.coord([api.value(2), categoryIndex]);
  var height = 10;
  var rectShape = echarts.graphic.clipRectByRect(
    {
      x: start[0],
      y: start[1] - height / 2,
      width: end[0] - start[0],
      height: height
    },
    {
      x: params.coordSys.x,
      y: params.coordSys.y,
      width: params.coordSys.width,
      height: params.coordSys.height
    }
  );
  return (
    rectShape && {
      type: 'group',
      children: [
        {
          type: 'rect',
          transition: ['shape'],
          shape: rectShape,
          style: api.style(),
          textConfig: {
            position: 'bottom',
            inside: false
          },
          textContent: {
            style: {
              text: api.value(3),
              fontSize: '12px',
              fontWeight: 'italic',
              textAlign: 'right',
              width: 5,
              transition: 'style'
            }
          }
        }
      ]
    }
  );
}
const dis = 10;// 线尾延长距离
option = {
  title: {
    text: '总周期:16个月',
    left: 'center'
  },
  dataZoom: [
    {
      type: 'inside',
      rangeMode:['percent'],
      filterMode: 'none',
    }
  ],
  tooltip:{
    show:true,
    trigger:'item',
    formatter:function(param){
      let val = JSON.parse(JSON.stringify(param.value))
      val.map((m,i)=>{
        if(i==1||i==2){
        val[i]=echarts.format.formatTime('yyyy-MM-dd',new Date(m))
        }
      })
      val.shift()
      return param.name+'<br>'+param.marker+val.join()
    }
  },
  grid: [
    {
      height: 400,
      top: 80,
    },
  ],
  xAxis: [
    {
      name: '时间',
      nameLocation: 'start',
      nameTextStyle: {
        fontWeight: 'bold'
      },
      type: 'time',
      max:function(value){
        return value.max+ 1000*60*60*24*40
      },
      minValueSpan:1000*3600*24*10,
      position: 'top',
      gridIndex: 0,
      boundaryGap:true,
      axisTick: {
        show: true
      },
      axisLine: {
        show: true,
        lineStyle: {
          width: 1
        }
      },
      splitLine: {
        show: true
      },
      axisLabel: {
        show: true,
        interval: 0,
        align: 'center',
        color: '#333'
      }
    },
  ],
  yAxis: [
    {
      type: 'category',
      name: '滚动时间日历',
      nameLocation: 'middle',
      nameTextStyle: {
        color: '#888',
        fontSize: 18
      },
      gridIndex: 0,
      inverse: true,
      axisTick: {
        show: false
      },
      axisLabel: {
        show: false
      },
    },
  ],

  series: [
    {
      type: 'custom',
      renderItem: renderItem,
      itemStyle: {
        opacity: 0.8
      },
      encode: {
        x: [1, 2],
        y: 0
      },
      data: data,
    },
    {
      type: 'custom',
       clip:true,
      renderItem: function (params, api) {
        const start = api.coord([api.value(1), api.value(0)]);
        const end = api.coord([api.value(2), api.value[0]]);
        const x2 = end[0];
        return {
          type: 'group',
          children: [
            {
              type: 'line',
              symbol: 'arrow',
              transition: ['shape'],
              z2:-1,
              silent:true,
              // 直线
              shape: {
                x1: start[0] ,
                y1: start[1],
                x2: x2 + dis,
                y2: start[1],
                percent: 1
              },
              style: {
                lineWidth: 1,
                stroke: '#333'
              },
              textContent: {
                x: start[0],
                y: start[1] - 24,
                style: {
                  text: api.value(3),
                  fontSize: '14px',
                  fontStyle: 'italic bold',
                  fill: '#dd5555'
                }
              }
            },
            {
              type: 'polygon',
              transition: ['shape'],
              silent:true,
              tooltip: {
                show: false
              },
              // 黑三角
              shape: {
                points: [
                  [x2 + 0 + dis, start[1] - 4],
                  [x2 + 0 + dis, start[1] + 4],
                  [x2 + 4 + dis, start[1] + 0]
                ]
              },
              style: {
                fill: '#666',
                stroke: '#333'
              }
            },
            {
              type: 'polygon',
              transition: ['shape'],
              silent:true,
              tooltip: {
                show: false
              },
              // 小红旗
              shape: {
                points: [
                  [x2 + 0 + dis + 5, start[1] - 8],
                  [x2 + 0 + dis + 5, start[1] + 14],
                  [x2 + 0 + dis + 5, start[1] + 4],
                  [x2 + 4 + dis + 16, start[1] + 4],
                  [x2 + 4 + dis + 5, start[1] - 5]
                ]
              },
              style: {
                fill: 'red',
                stroke: '#333'
              }
            }
          ]
        };
      },
      encode: {
        x: [1, 2],
        y: 0
      },
      data: lineData,
    }
  ]
};


 5721
5721

 被折叠的 条评论
为什么被折叠?
被折叠的 条评论
为什么被折叠?
 到【灌水乐园】发言


