


目的
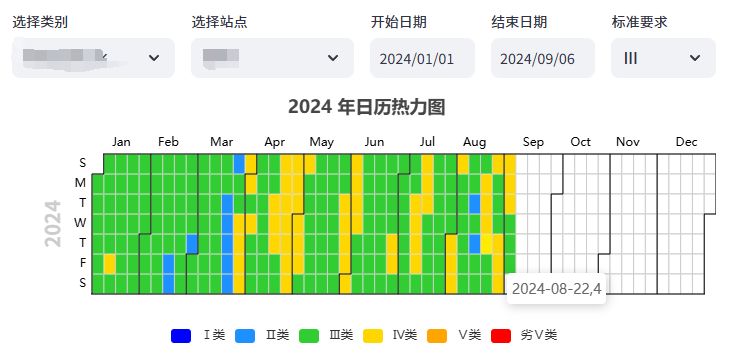
使用 python 将站点水质等级以日历图形式可视化。实现快速掌握站点长期水质状况及时间变化趋势。
成果预览
功能特点
- 查询站点、任意时间段水质等级。
- 可自定义参与评价的因子
- 日历图有有图例,支持鼠标交互显示时间和水质等级
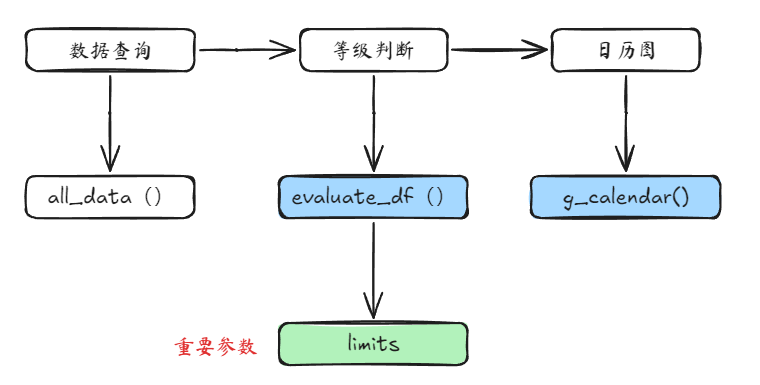
实现路径
环境及依赖
还是利用 python streamlit 框架,日历图需要依赖包为 pyecharts、streamlit_echarts。
python = 3.12.0
streamlit==1.38.0
streamlit-echarts==0.4.0
pyecharts==2.0.6
代码
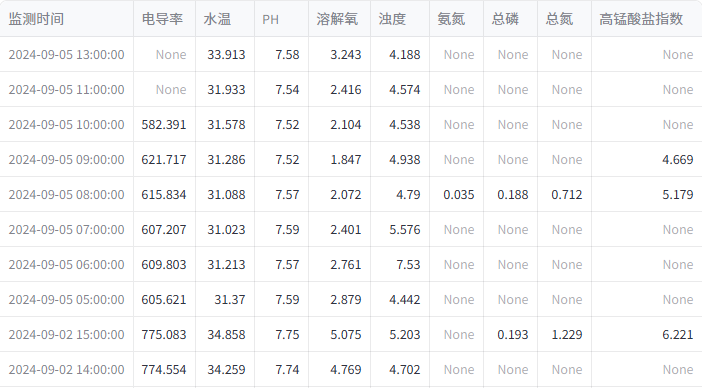
数据查询
根据自身情况,用数据库或者 Excel 都可以,只要有监测时间和监测因子就行。数据示例如下。
等级判断
evaluate_df(df, limits, standard_map) 函数根据以水质监测数据的 DataFrame、包含各因子评价限值的字典、包含评价等级与数值对应关系的字典来获得每个因子的数据等级。程序中加入了异常判断。
def evaluate_df(df, limits, standard_map):
    """
    评价DataFrame中的水质数据,并返回一个新的带有评价等级的DataFrame。

    参数:
    df: DataFrame,包含水质监测数据的DataFrame,其中第一列为'监测时间',其他列为不同因子的监测值。
    limits: dict,包含各因子评价限值的字典,用于确定各因子的评价等级。
    standard_map: dict,包含评价等级与数值对应关系的字典,用于将评价等级映射为数值。

    返回:
    DataFrame,包含原始数据和各因子评价等级、站点等级的新DataFrame。
    """    # 在原有 DataFrame 上添加新列
    result_df = df.copy()  # 复制原有 DataFrame 以保留原数据

    # 遍历df中的每一行
    for index, row in df.iterrows():
        # 初始化最大等级为未定义
        max_level = standard_map["未定义"]
        # 遍历每一列,除了'监测时间'
        for column in df.columns[1:]:
            factor = column  # 获取当前列的因子名称

            # 检查是否为空值
            if pd.isna(row[column]):
                result_df.at[index, f'{factor}评价等级'] = standard_map["空值"]  # 标记为空值
                continue

            if column in limits:  # 如果列存在于limits中
                level = water_quality_levels(column, row[column], limits[column])
                numeric_level = standard_map[level]
                result_df.at[index, f'{factor}评价等级'] = numeric_level  # 添加新列存储等级
                # 更新最大等级
                max_level = max(max_level, numeric_level)
            else:
                # 如果列不在limits中,标记为未定义
                result_df.at[index, f'{factor}评价等级'] = standard_map["未定义"]

        # 计算站点等级并添加到新的DataFrame
        result_df.at[index, '站点等级'] = max_level
    return result_df
评价限值limits
这个之前有过介绍,是根据《地表水环境质量标准》(GB 3838-2002)要求建立的字典。如果需要自定义 limits 可以通过多选查询对应的限值来替换入参。
limits = {
    "高锰酸盐指数": [2, 4, 6, 10, 15],
    "氨氮": [0.15, 0.5, 1, 1.5, 2.0],
    "总磷": [0.02, 0.1, 0.2, 0.3, 0.4],
    "化学需氧量": [15, 15, 20, 30, 40],
    "五日生化需氧量": [3, 3, 4, 6, 10],
    "氟化物": [1, 1, 1, 1.5, 1.5],
    "pH": [6, 9],  # pH的特殊处理,下限为6,上限为9
    "溶解氧": [7.5, 6, 5, 3, 2]  # 溶解氧的特殊处理,只有下限
}
standard_map
评价等级与数值对应关系的字典
standard_map = {"Ⅰ": 1, "Ⅱ": 2, "Ⅲ": 3, "Ⅳ": 4, "Ⅴ": 5, "劣Ⅴ": 6, "未定义": -1, "空值": -2}
日历图
为了在 streamlit 实现日历图,尝试了很多依赖,streamlit 自身支持的较好的 plotly 没有日历图,matplotlib、camlp 都是静态的,不好看。最终选择了第三方包 pyecharts 绘制,streamlit_echarts 展示。注意最后一定要用 st_pyecharts () 来展示,才能在 web 中很好的显示。
from pyecharts import options as opts
from pyecharts.charts import Calendar
from streamlit_echarts import st_pyecharts
import streamlit as st


def generate_calendar(df):
    """
    使用pyecharts 和streamlit_echarts生成水质日历热力图。
    参数:
    df (DataFrame): 包含水质数据的Pandas DataFrame,必须包括水质等级和日期(或索引作为日期)。
    返回:
    calendar_chart (Chart object): 生成的日历热力图对象。
    """    # 检查是否有“监测时间”列,如果没有则使用索引作为日期
    # 获取年份用于标题
    year = df['监测时间'].dt.year.unique()[0]
    df['监测时间'] = df['监测时间'].dt.strftime('%Y-%m-%d')
    # 确保水质等级是数值类型
    df['站点等级'] = pd.to_numeric(df['站点等级'])
    # 获取日期和水质等级数据
    data = df[['监测时间', '站点等级']].values.tolist()
    # 创建日历热力图
    calendar_chart = (
        Calendar().add("", data, calendar_opts=opts.CalendarOpts(range_=str(year)),
                       daylabel_opts=opts.CalendarDayLabelOpts(name_map="cn"),
                       monthlabel_opts=opts.CalendarMonthLabelOpts(name_map="cn"),
                       tooltip_opts=opts.TooltipOpts(
                           trigger="item",
                           # 自定义提示框格式化器
                           formatter=JsCode("""
                     function(params) {                     return  params.name  + params.value;                     }                 """),
                       ))
        .set_global_opts(
            title_opts=opts.TitleOpts(title=f" {year} 年日历热力图", pos_left="center")
            ,
            visualmap_opts=opts.VisualMapOpts(
                max_=6,
                min_=1,
                orient="horizontal",
                pos_top="230px",
                pos_left="center",
                is_piecewise=True,
                pieces=[
                    {"min": 1, "max": 1, "label": "Ⅰ类", "color": "#0000FF"},
                    {"min": 2, "max": 2, "label": "Ⅱ类", "color": "#1E90FF"},
                    {"min": 3, "max": 3, "label": "Ⅲ类", "color": "#32CD32"},
                    {"min": 4, "max": 4, "label": "Ⅳ类", "color": "#FFD700"},
                    {"min": 5, "max": 5, "label": "Ⅴ类", "color": "#FFA500"},
                    {"min": 6, "max": 6, "label": "劣Ⅴ类", "color": "#FF0000"},
                ],
            ),
        )
    )
    return calendar_chart
hour_pic = generate_calendar(df_day)
st_pyecharts(hour_pic)
参考文件
Streamlit ECharts Demo · Streamlit
Calendar - Calendar_label_setting - Document (pyecharts.org)
pyecharts/pyecharts-gallery: Just use pyecharts to imitate Echarts official example. (github.com)
andfanilo/streamlit-echarts: A Streamlit component to render ECharts. (github.com)
Examples - Apache ECharts
BY
纯个人经验,如有帮助,请收藏点赞,如需转载,请注明出处。
微信公众号:环境猫 er
CSDN : 细节处有神明
个人博客: https://maoyu92.github.io/


 被折叠的 条评论
为什么被折叠?
被折叠的 条评论
为什么被折叠?
 到【灌水乐园】发言


