


import base64
import hashlib
import hmac
import urllib.parse
import time
import json
import matplotlib
import matplotlib.pyplot as plt
import numpy as np
import pymysql
import requests
from pylab import mpl
mpl.rcParams["font.sans-serif"] = ["SimHei"]
mpl.rcParams["axes.unicode_minus"] = False
png_name = time.strftime("%Y%m%d%H%M%S", time.gmtime())
def webhook_sign():
'''
加签
'''
timestamp = str(round(time.time() * 1000))
webhook = 'https://oapi.dingtalk.com/robot/send?access_token=9f3b1caf0e5'
secret = 'SECd3ed4cb7969e4'
secret_enc = secret.encode('utf-8')
string_to_sign = '{}\n{}'.format(timestamp, secret)
string_to_sign_enc = string_to_sign.encode('utf-8')
hmac_code = hmac.new(secret_enc, string_to_sign_enc, digestmod=hashlib.sha256).digest()
sign = urllib.parse.quote_plus(base64.b64encode(hmac_code))
url = webhook + '×tamp=' + timestamp + '&sign=' + sign
return url
def sql(needwhat=None):
global result_all
db = pymysql.Connect(
host='129.190.198.110',
port=3306,
user='dw',
password='Dwyfb',
db='test',
charset='utf8'
)
cur = db.cursor(pymysql.cursors.DictCursor)
if needwhat == None:
result = ()
sql = "select MONTH(tmp.add_time) as yue,count(*) as ordernum,CAST(sum(tmp.order_amount) AS CHAR) as order_amount from (select order_amount,add_time from jingdong_order where order_status NOT IN (- 1,- 10, 0 ) and dispatch_status !=4 union ALL select order_amount,addtime from tianmao_order where order_status not in(2,3) and dispatch_status !=4)tmp where year(tmp.add_time) = year(curdate()) GROUP BY MONTH(tmp.add_time)"
cur.execute(sql)
result_all = cur.fetchall()
print("result_all======", result_all)
cur.close()
db.close()
return result_all
def CreateChart():
# 1.准备数据
labels = []
gold_medal = []
silver_medal = []
bronze_medal = []
all_sta = sql()
for item in all_sta:
labels.append(item["yue"])
gold_medal.append(item["ordernum"])
silver_medal.append(float((item["order_amount"])))
print(silver_medal)
x = np.arange(len(labels)) # x轴位置
width = 0.4 # 直方图的宽度
fig, ax = plt.subplots()
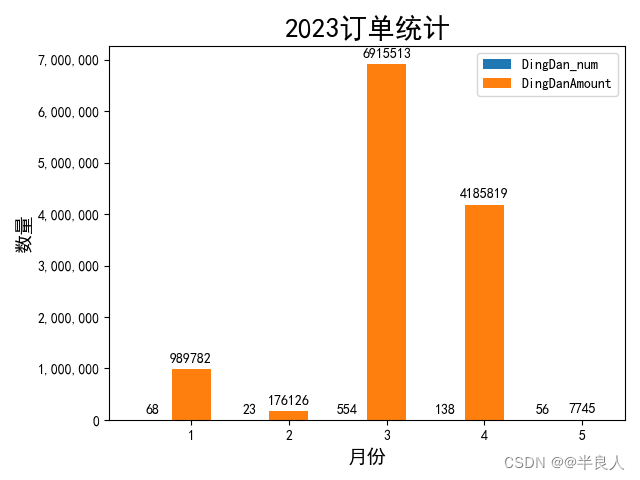
rects1 = ax.bar(x - width, gold_medal, width, label='DingDan_num')
rects2 = ax.bar(x, silver_medal, width, label='DingDanAmount')
# 控制纵坐标数据显示格式(默认显示科学计数法)
ax.get_yaxis().set_major_formatter(matplotlib.ticker.FuncFormatter(lambda x, p: format(int(x), ',')))
# rects3 = ax.bar(x + width, bronze_medal, width, label='bronze_medal')
# 设置标题及字体大小
ax.set_xlabel('月份', fontsize=14)
ax.set_ylabel('数量', fontsize=14)
ax.set_title('2023订单统计', fontsize=20)
ax.set_xticks(x, labels)
# 设置图例
ax.legend()
# fmt控制标签数据格式(默认过大的话显示科学计数法)
ax.bar_label(rects1, padding=3, fmt="%.f")
ax.bar_label(rects2, padding=3, fmt="%.f")
# ax.bar_label(rects3, padding=3)
fig.tight_layout()
localFile = f'/usr/local/apache-tomcat-7.0.78/webapps/ROOT/OrderNumTongJi/{png_name}.png'
plt.savefig(localFile)
def test_send_markdown():
CreateChart()
headers = {"Content-Type": "application/json;charset=utf-8"}
at_all = True
photo = f''
message = {
"msgtype": "markdown",
"markdown": {
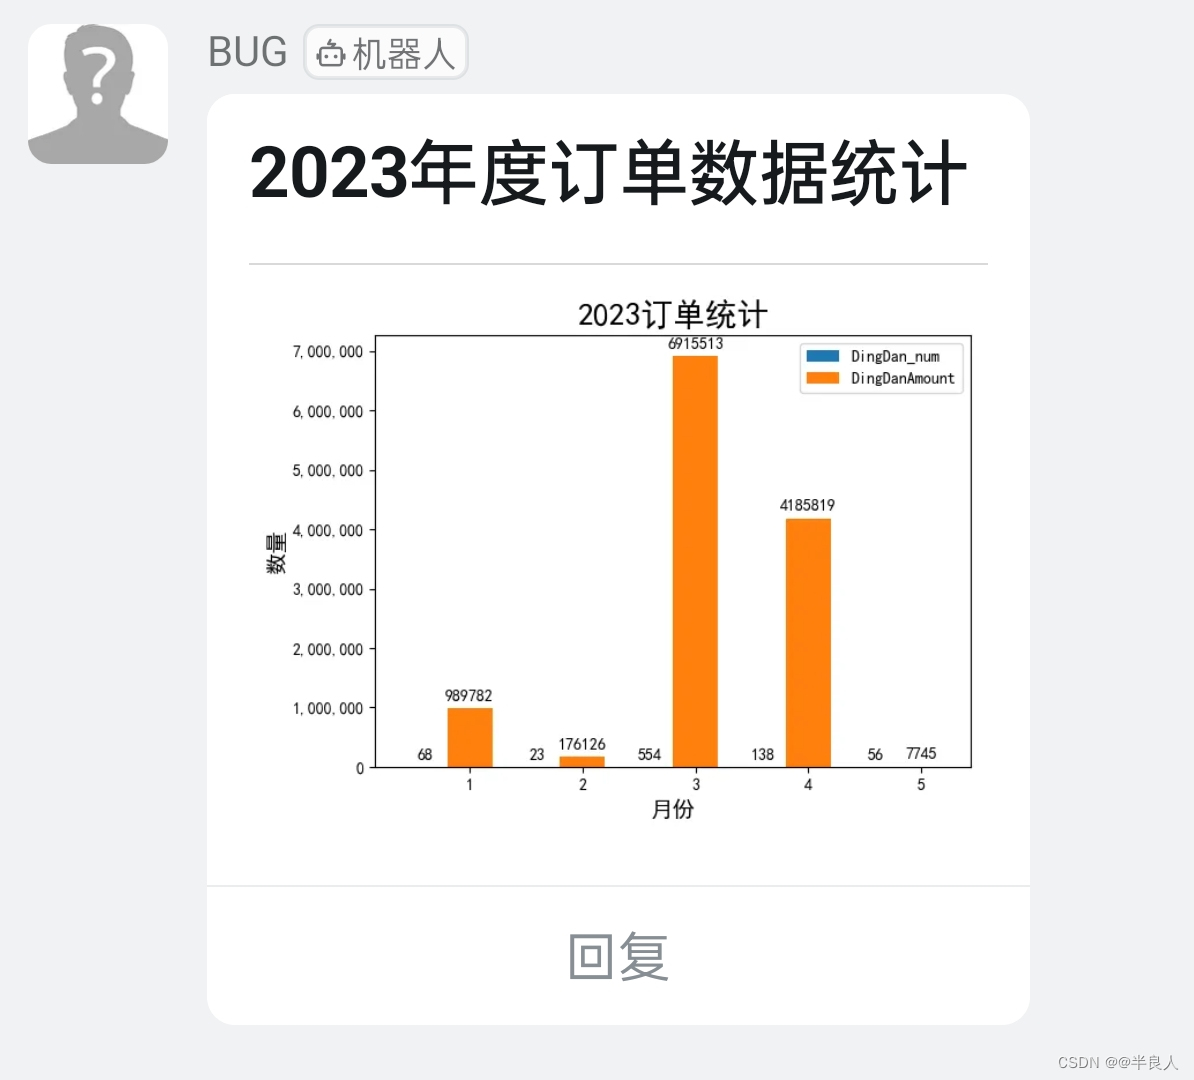
"title": "2023年度订单数据统计",
"text": "# **2023年度订单数据统计**\n---\n" +photo
},
"at": {
"isAtAll": at_all
}
}
try:
res = requests.post(webhook_sign(), data=json.dumps(message), headers=headers, verify=False)
return res
except Exception as e:
return {"errmsg": repr(e)}


 556
556


 被折叠的 条评论
为什么被折叠?
被折叠的 条评论
为什么被折叠?
 到【灌水乐园】发言


