


一、绘制静止图像
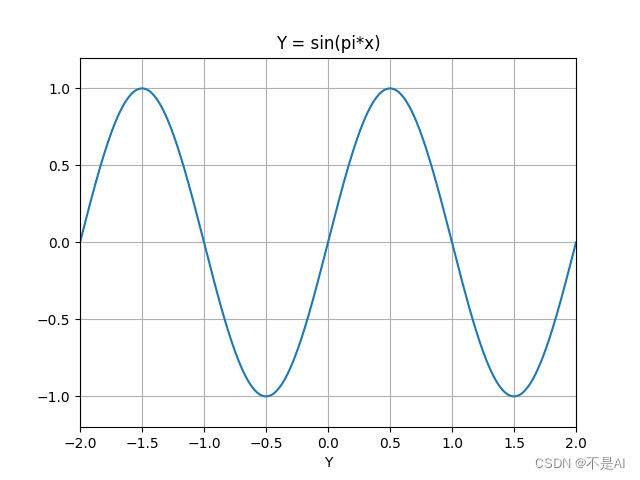
使用matplotlib库绘制函数图像y = sin(pi * x):
import math
import matplotlib.pyplot as plt

x_min = -2.0
x_max = 2.0

N = 1000

x1 = []
y1 = []

for i in range(N + 1):
    x = x_min + (x_max - x_min) * i / N
    y = math.sin(math.pi * x)
    x1.append(x)
    y1.append(y)

plt.xlim([-2, 2])
plt.ylim([-1.2, 1.2])

plt.plot(x1, y1)
plt.title("Y = sin(pi*x)")
plt.xlabel("X")
plt.xlabel("Y")

plt.grid()
plt.show()
程序输出:
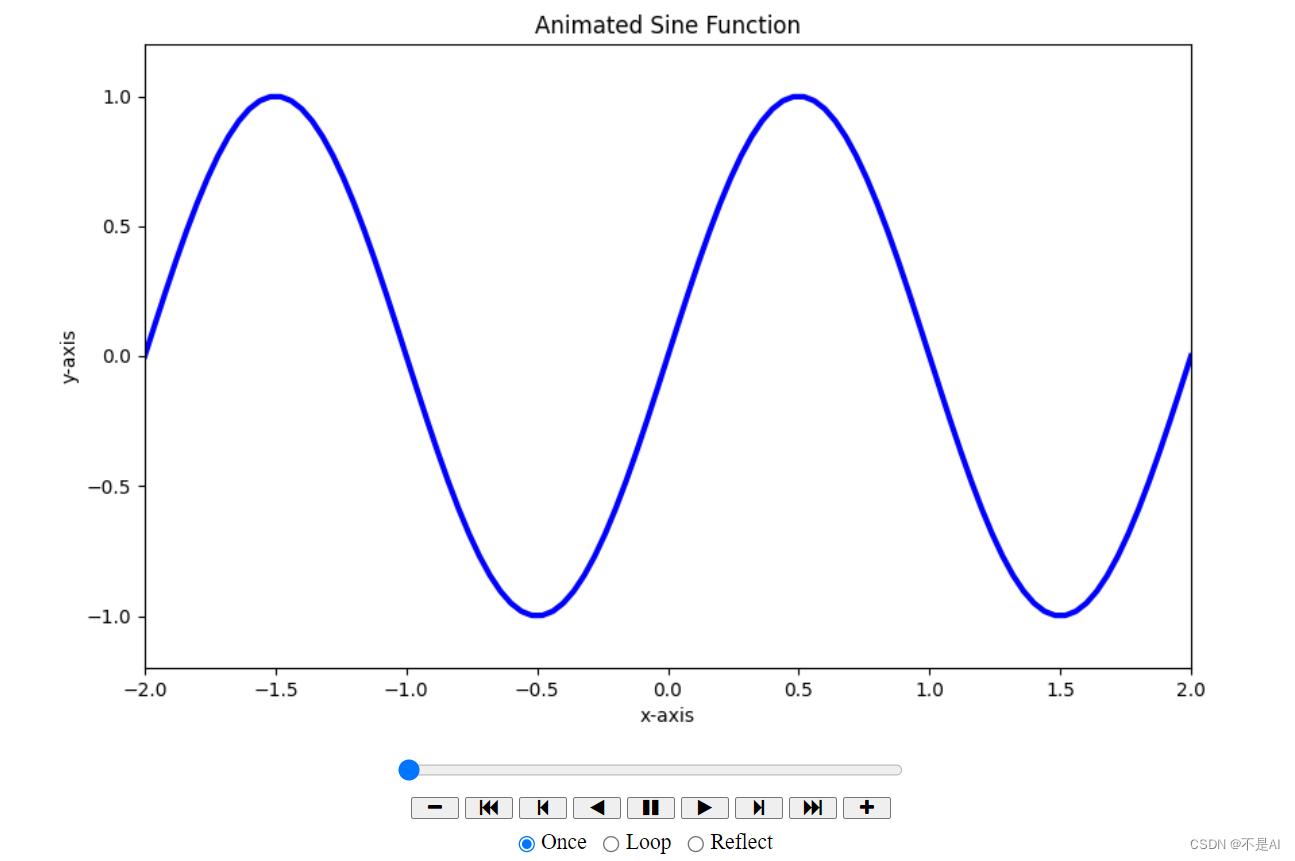
二、绘制图形动画
import math
import matplotlib.pyplot as plt
import matplotlib.animation as animation

fig = plt.figure(figsize=(10, 6))

x_min = -2.0
x_max = 2.0

ims = []

N = 100
AN = 30

for a in range(AN):
    phi = 2.0 * math.pi * a / AN

    xl = []
    yl = []

    for i in range(N + 1):
        x = x_min + (x_max - x_min) * i / N
        y = math.sin(math.pi * x + phi)
        xl.append(x)
        yl.append(y)

    img = plt.plot(xl, yl, color="blue", linewidth=3.0, linestyle="solid")
    ims.append(img)

plt.title("Animated Sine Function")
plt.xlabel("x-axis")
plt.ylabel("y-axis")

plt.xlim([-2.0, 2.0])
plt.ylim([-1.2, 1.2])

ani = animation.ArtistAnimation(fig, ims, interval=50)
ani.save("output.html", writer=animation.HTMLWriter())

plt.grid()
plt.show()
使用浏览器打开生成的html文件:
参考文献 Reference
《14天自造量子计算机:使用薛定谔方程》,【日】远藤理平 著,陈欢 译,北京,中国水利水电出版社,2023年9月。


 408
408

 被折叠的 条评论
为什么被折叠?
被折叠的 条评论
为什么被折叠?
 到【灌水乐园】发言


