


GRACE监测的格林兰岛冰川质量变化趋势存在正负的区域,现在我们可以在谷歌地球上直接勾出外围的轮廓。
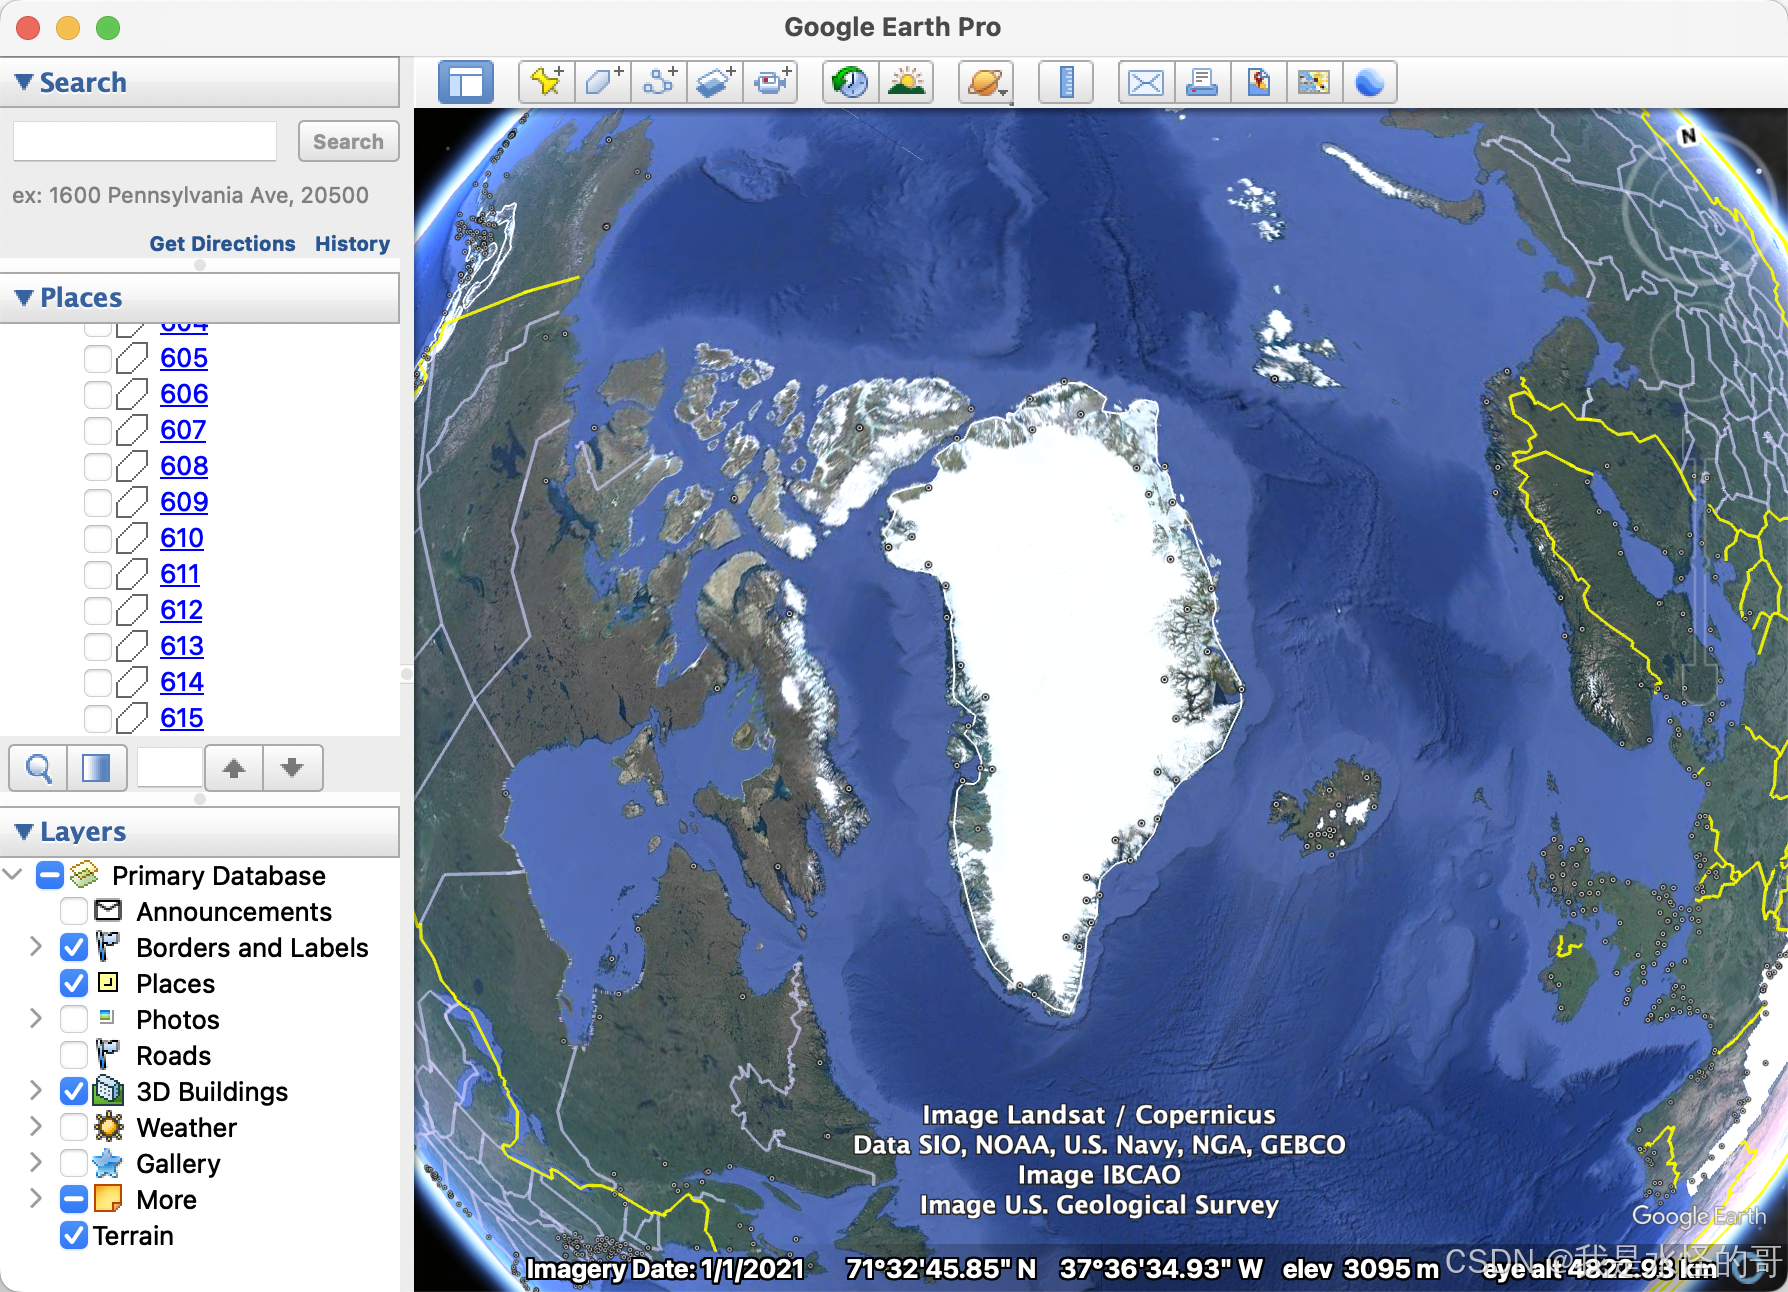
而其内部存在正信号,因此不能直接勾出正信号的轮廓经纬度范围。
下面提供一个算法可以自动提取出格林兰岛内部正趋势的区域的经纬度范围。
%% Chistrong Wen
%% University of Stuttgart
%% 2025-3-11 23:48
xy= load('Greenland.txt');
xy(:,1) = 360+xy(:,1);
ind_mask = inpolygon(trend2.lon,trend2.lat,xy(:,1),xy(:,2));
A = ind_mask.*trend2.rg;
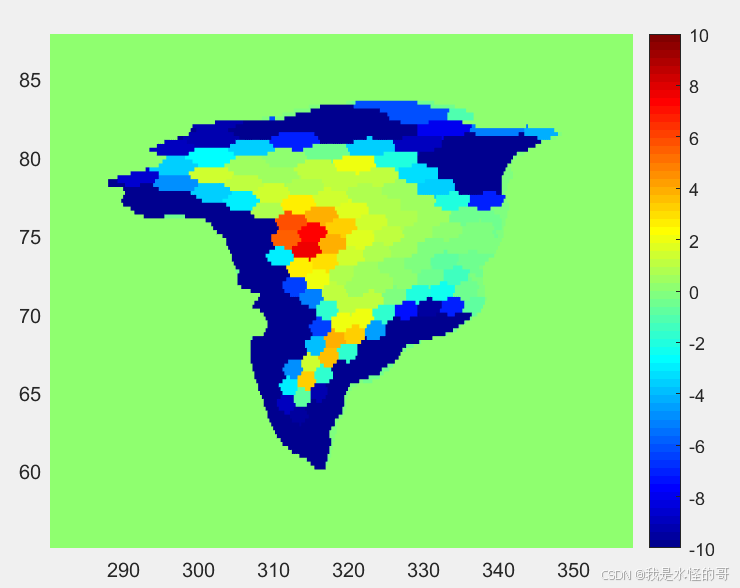
subplot(2,2,1)
pcolor(trend2.lon,trend2.lat,A)
shading flat
colormap(jet)
caxis([-10,10])
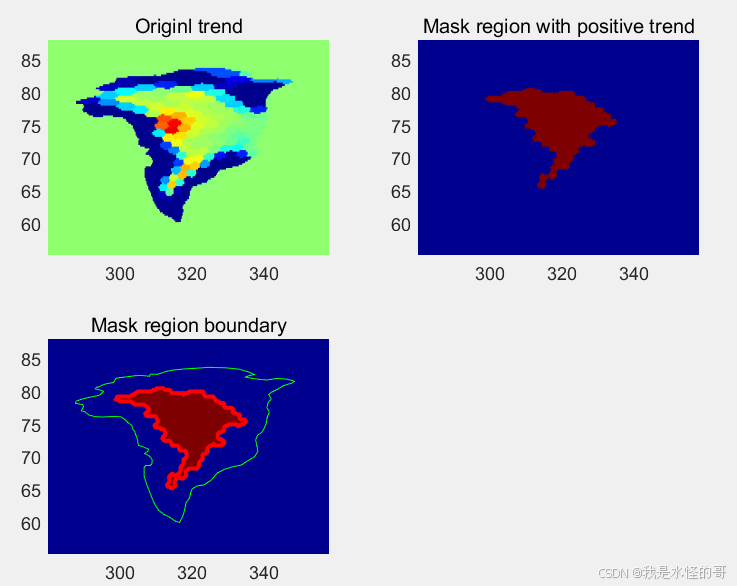
title('Originl trend')
subplot(2,2,2)
B = A;
B(B<0)=NaN;
B(B==0)=NaN;
B(isnan(B))=0;
B(B~=0)=1;
pcolor(trend2.lon,trend2.lat,B)
shading flat
title('Mask region with positive trend')
bound1 = bwboundaries(B);for k = 1:length(bound1)
boundary = bound1{k};
boundaryLat = interp2(1:size(trend2.lat,2), 1:size(trend2.lat,1), trend2.lat, boundary(:,2), boundary(:,1));
boundaryLon = interp2(1:size(trend2.lon,2), 1:size(trend2.lon,1), trend2.lon, boundary(:,2), boundary(:,1));
end
%%
subplot(2,2,3)
pcolor(trend2.lon,trend2.lat,B)
shading flat
hold on
plot(boundaryLon, boundaryLat, 'r', 'LineWidth', 2);
plot(xy(:,1),xy(:,2),'g')
title('Mask region boundary')
%% save data
out_greenland = xy;
inner_greenland = [boundaryLon, boundaryLat];
运行结果:
❤️欢迎点赞收藏❤️


 被折叠的 条评论
为什么被折叠?
被折叠的 条评论
为什么被折叠?
 到【灌水乐园】发言


