


1.GPCC降水数据集的下载
GPCC(全球降水气候中心)于1989年应世界气象组织(World Meteorological Organization,WMO)的要求成立,由德国国家气象局(Deutscher Wetterdienst)运营。提供基于全球约86100个雨量计、站点构建的降水数据集,主要是通过世界气象组织(WMO)和全球电信系统(Global Telecommunication System,GTS)提供的台站数据库(SYNOP与CLIMAT)所产生。其任务为基于观测降雨数据对全球地表日和月降水进行分析,是世界上最大的降水数据库。GPCC的所有产品均为基于观测的全球陆地表面网格降水数据集,空间分辨率为1.0°,并根据产品的不同,可提供0.25°、0.5°和2.5°的额外空间分辨率。GPCC优势在于使用大量站点观测数据,计算网格数量较大。但随着时间推移,可能会受到每个网格中站点数量变化的限制(知乎)。
下载链接:https://opendata.dwd.de/climate_environment/GPCC/html/download_gate.html

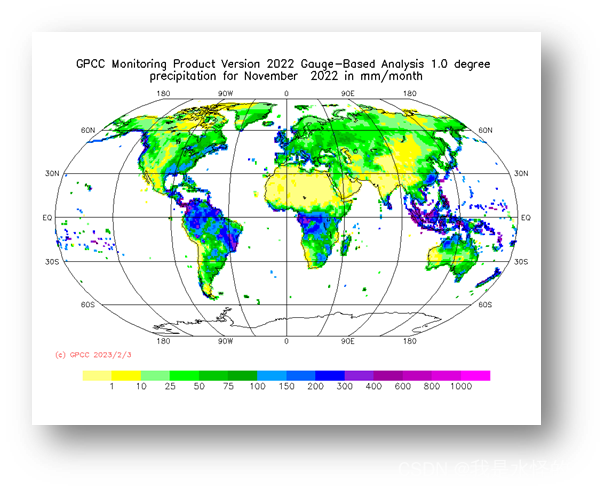
我们可以看到有不同的产品,其具有不同的空间分辨率和时间覆盖度,并且可用于干旱监测、极端气候分析、卫星数据标定、以及水文学研究。另外还有一个可视化的操作界面,点击表格内的GPCC Visualizer,进入可视化界面,设置好全球的范围,投影方式,导出的图片格式,点击开始可视化即可生成图片。

导出某一个月的降水数据。
2.降水数据集的读取与分析
此处我们选择1°×1°空间分辨率的 Monitoring Version 2022数据,其数据时间范围为1982-present。我本人使用的是早些时间下载的 monitoring_v2020_10_2003_01版本,此处换成重新下载的monitoring_v2022_10_2003_01即可。
%%%%%%%%%%%%%%%%%%%%%%%%%%%%%%%%%%%%%%%%%%%%%%%%%%%%%%%%%%%%%%%%%%%%%%%%%%%
%% GPCP PRECIPITATION
% CHISTRONG WEN
% 2023-2-2
%%
IN_ADDRESS = 'D:\SCI_E\数据\gmt\GMT_new\Yangtze_Yellow_water_consumption\yangtze_river_runoff_discharge_v2\GPCC\';
GFA = dir(fullfile(IN_ADDRESS,'*.nc'));
ncdisp([IN_ADDRESS,GFA(1).name])
lon = ncread([IN_ADDRESS,GFA(1).name],'lon');
lat = ncread([IN_ADDRESS,GFA(1).name],'lat');

[lon,lat] = meshgrid(lon,lat);
GPCC.lon = lon;
GPCC.lat = lat;

for ii = 1:length(GFA)
    file_name = [IN_ADDRESS,GFA(ii).name];
    A_ecco = ncread(file_name,'p');
    time = ncread([IN_ADDRESS,GFA(ii).name],'time');
    strtime = num2str(time);
    year  = str2num(strtime(1:4));
    month = str2num(strtime(5:6));
    day   = str2num(strtime(7:8));
    tout = time_transfer([year,month,day],1);
    A_ecco(isnan(A_ecco))=0;
    GPCC.rg(:,:,ii) = A_ecco';
    GPCC.tt(:,ii) = tout;
end
得到的输出结果

下面以长江流域为例,绘制时间序列
%% ACQUIRE TIME SERIES
GRID = GPCC.rg;
rg_plot(GPCC,GPCC.rg(:,:,12))
dir_msk = 'C:\GRACE_Matlab_Toolbox\GRACE_data\boundary_files\yangtze.bln';
type = 'line';
bound = 90;
[plot_region]=gmt_grid2series(GRID,dir_msk,type,bound);
plot_region = plot_region; % CONVERT M TO CM
%% PLOT
figure('position',[500,500,1000,300]);
plot(GPCC.tt,plot_region,'-','color','r')
hold on
bar(GPCC.tt,plot_region)
grid on;
% ylim([min(plot_region)-5,max(plot_region)+5])
set(gca,'gridlinestyle',':','LineWidth',0.5,'GridAlpha',0.5)
xlabel('year', 'Fontname', 'Times New Roman', 'Fontsize',14);
ylabel('Precipitation mm/month', 'Fontname', 'Times New Roman', 'Fontsize',14); 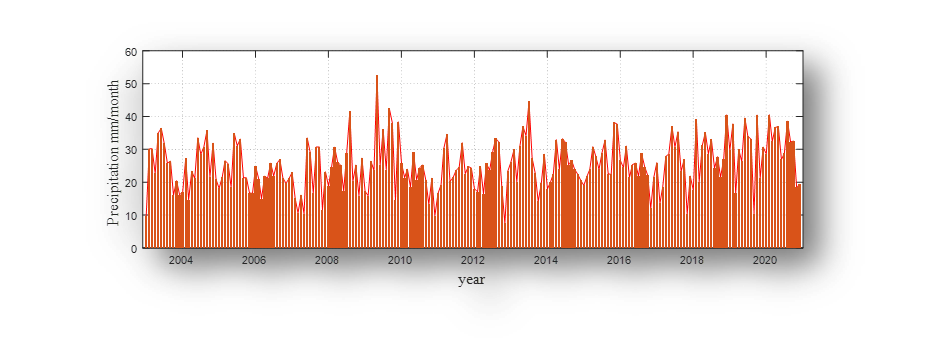
同时进行周年振幅、相位、趋势项的分析。【注意此处的代码有所修改,主要是代码读取的tt1.txt文件,之前是存放缺失的年份,此处我全部替换为0。具体参考本人的B站专栏】
%% ANALYSIS OF THE TIME SERIES
tt = load('tt1.txt');
% [Amplitude1, Amplitude1_std, Phase1,...
% Phase1_std, Amplitude2, Amplitude2_std,...
% Phase2, Phase2_std, Trend, Trend_std,...
% Trend_line, Resid, Interp] = gmt_harmonic(GPCC.tt,tt,GRID);
lon = -179.5:1:179.5;
lat = -89.5:1:89.5;
[lon,lat] = meshgrid(lon,lat);
am.lon = lon;
am.lat = lat;
am.rg = flipud(Amplitude1);
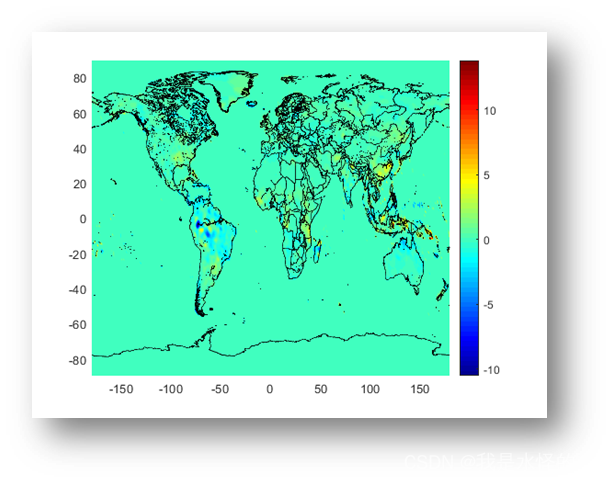
figure
wzq_plot(am)结果图
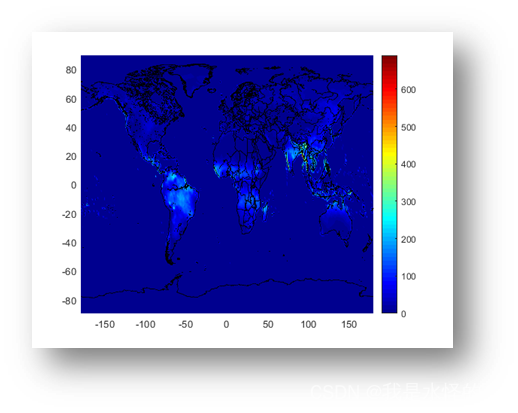
【周年振幅】
【周年相位】
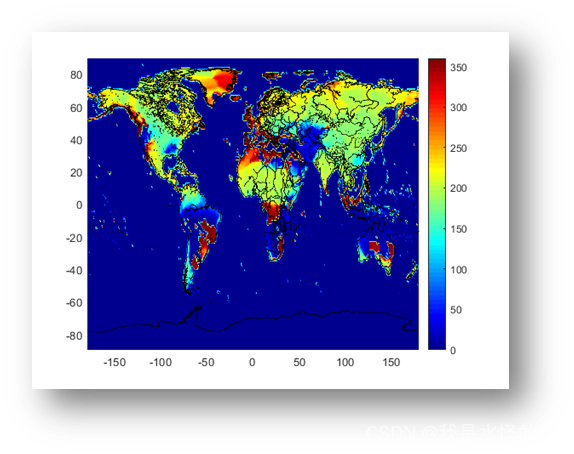
【线性趋势】
@期待您的点赞、收藏、转发@


 8161
8161

 被折叠的 条评论
为什么被折叠?
被折叠的 条评论
为什么被折叠?
 到【灌水乐园】发言


