


效果图展示

注意部分
背景圆角效果实现(当前使用echarts4.9.0版本,如部分效果失效,可能版本原因所致)
完整代码展示
<template>
<div ref="chartItem" style="width: 520px; height: 190px"></div>
</template>
<script>
import echarts from 'echarts'
import { getVisualToolData } from '@/services/visualTool/chartOption'
export default {
data() {
return {
yData1: ['xx装置', 'xx公司', '消耗量'],
yData2: ['aaa', 'bbb', '消耗量'],
serData1: [10, 20, 30],
serData2: [15, 65, 20],
}
},
mounted() {
this.initEcharts()
},
methods: {
initEcharts() {
let myChart = echarts.init(this.$refs.chartItem)
let glbOpt = {
txtFontSize: 14,
toolFontSize: 16,
fontFamily: 'SourceHanSansCN-Medium',
txtColor: '#ffffff',
nameColor1: '#309BFF',
nameColor2: '#E3A953',
lineColor1: '#18A1E2',
lineColor2: '#D9A250',
}
let option = {
tooltip: {
show: true,
trigger: 'item',
textStyle: {
fontSize: glbOpt.toolFontSize,
},
},
grid: [
{
left: 20,
right: 355,
top: 60,
bottom: 16,
},
{
left: 355,
right: 20,
top: 60,
bottom: 16,
},
],
xAxis: [
{
type: 'value',
gridIndex: 0,
inverse: true,
axisLine: {
show: false,
},
splitLine: {
show: false,
},
axisTick: {
show: false,
},
axisLabel: {
show: false,
},
data: [],
},
{
type: 'value',
gridIndex: 1,
inverse: false,
axisLine: {
show: false,
},
splitLine: {
show: false,
},
axisTick: {
show: false,
},
axisLabel: {
show: false,
},
data: [],
},
],
yAxis: [
{
name: '原材料入库量',
nameTextStyle: {
padding: [0, 0, 10, 0],
color: glbOpt.nameColor1,
fontSize: 16,
},
boundaryGap: false,
type: 'category',
axisLine: {
show: true,
lineStyle: {
color: glbOpt.lineColor1,
},
},
splitLine: {
show: false,
},
axisTick: {
show: false,
},
axisLabel: {
show: true,
rich: {
nt: {
padding: [0, 4],
width: 70,
height: (45 / this.serData1.length) * 2,
color: '#fff',
align: 'left',
fontSize: 12,
borderWidth: 1,
borderRadius: 45 / this.serData1.length,
borderColor: '#1CA8FF',
backgroundColor: 'rgba(10, 46, 99, 0.23)',
},
},
formatter: function (params) {
return '{nt' + '|' + params + '}'
// 文字溢出部分... 效果
// let val
// if (params.length > 5) {
// val = params.substr(0, 5) + '...'
// return '{nt' + '|' + val + '}'
// } else {
// return '{nt' + '|' + params + '}'
// }
},
},
data: this.yData1,
position: 'right',
},
{
name: '产成品',
nameTextStyle: {
padding: [0, 0, 10, 0],
color: glbOpt.nameColor2,
fontSize: 16,
},
boundaryGap: false,
type: 'category',
gridIndex: 1,
axisLine: {
show: true,
lineStyle: {
color: glbOpt.lineColor2,
},
},
splitLine: {
show: false,
},
axisTick: {
show: false,
},
axisLabel: {
show: true,
rich: {
nt: {
padding: [0, 4],
width: 70,
height: (45 / this.serData2.length) * 2,
color: '#fff',
align: 'right',
fontSize: 12,
borderWidth: 1,
borderRadius: 45 / this.serData2.length,
borderColor: 'rgba(229, 170, 84, 1)',
backgroundColor: 'rgba(10, 46, 99, 0.23)',
},
},
formatter: function (params) {
return '{nt' + '|' + params + '}'
},
},
data: this.yData2,
},
],
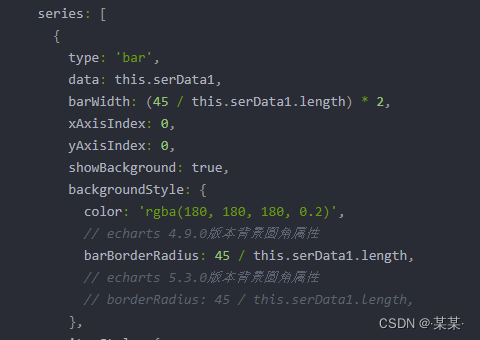
series: [
{
type: 'bar',
data: this.serData1,
barWidth: (45 / this.serData1.length) * 2,
xAxisIndex: 0,
yAxisIndex: 0,
showBackground: true,
backgroundStyle: {
color: 'rgba(180, 180, 180, 0.2)',
// echarts 4.9.0版本背景圆角属性
barBorderRadius: 45 / this.serData1.length,
// echarts 5.3.0版本背景圆角属性
// borderRadius: 45 / this.serData1.length,
},
itemStyle: {
normal: {
barBorderRadius: 45 / this.serData1.length,
color: new echarts.graphic.LinearGradient(0, 0, 1, 0, [
{
offset: 0,
color: 'rgba(14, 89, 171, 1)',
},
{
offset: 1,
color: 'rgba(25, 166, 230, 1)',
},
]),
},
},
label: {
show: true,
position: 'insideRight',
fontFamily: glbOpt.fontFamily,
fontSize: glbOpt.txtFontSize,
color: glbOpt.txtColor,
},
},
{
type: 'bar',
data: this.serData2,
barWidth: (45 / this.serData2.length) * 2,
// color: '#01b3e0',
xAxisIndex: 1,
yAxisIndex: 1,
showBackground: true,
backgroundStyle: {
color: 'rgba(180, 180, 180, 0.2)',
// echarts 4.9.0版本背景圆角属性
barBorderRadius: 45 / this.serData2.length,
// echarts 5.3.0版本背景圆角属性
// borderRadius: 45 / this.serData2.length,
},
itemStyle: {
normal: {
barBorderRadius: 45 / this.serData2.length,
color: new echarts.graphic.LinearGradient(1, 0, 0, 0, [
{
offset: 0,
color: 'rgba(109, 83, 43, 1)',
},
{
offset: 1,
color: 'rgba(230, 171, 84, 1)',
},
]),
},
},
label: {
show: true,
position: 'insideLeft',
fontFamily: glbOpt.fontFamily,
fontSize: glbOpt.txtFontSize,
color: glbOpt.txtColor,
},
},
],
}
myChart.setOption(option, true)
window.addEventListener('resize', () => {
myChart.resize()
})
},
},
}
</script>


 1581
1581


 被折叠的 条评论
为什么被折叠?
被折叠的 条评论
为什么被折叠?
 到【灌水乐园】发言


