164种默认colormap样式【附图】

找到了这篇,还有分类Python 画图常用颜色
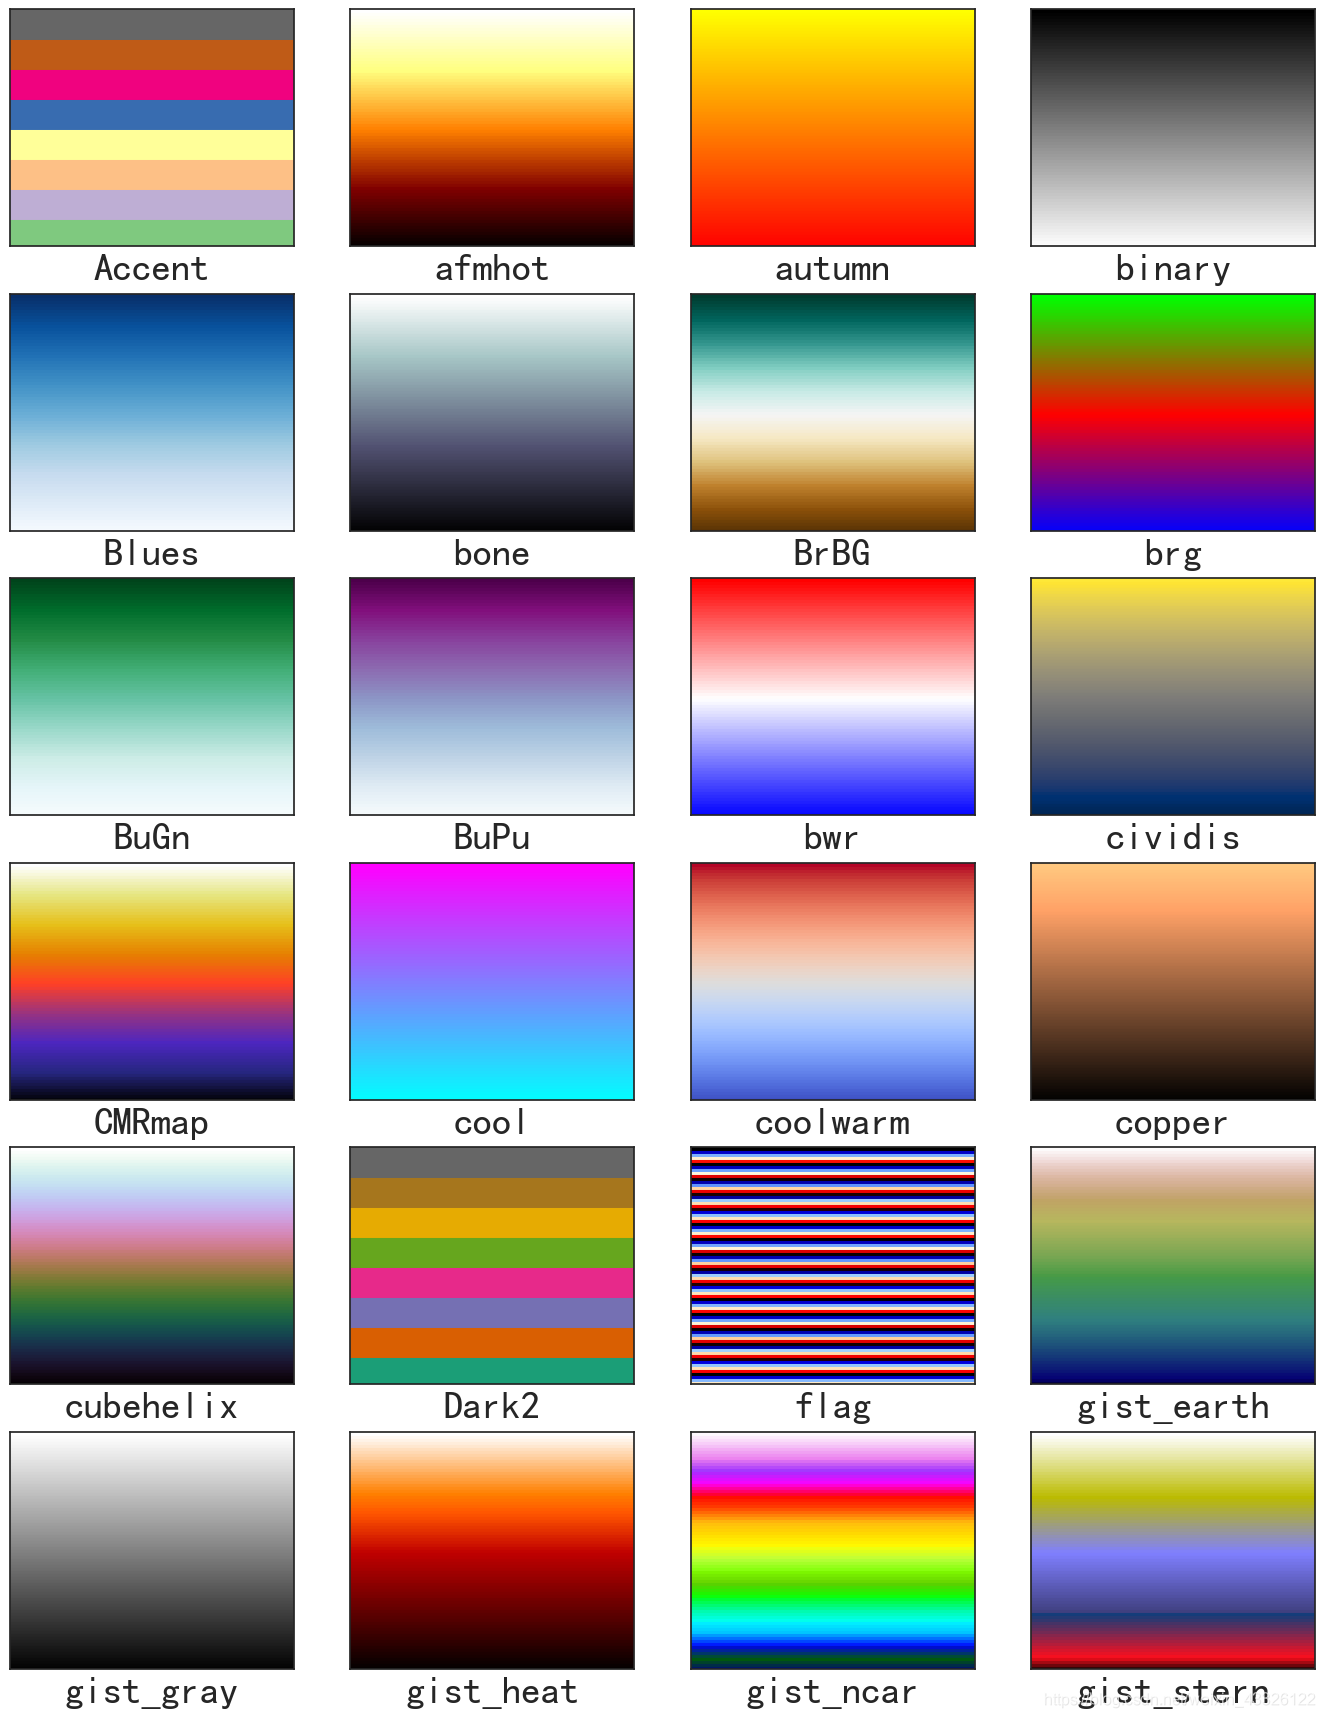
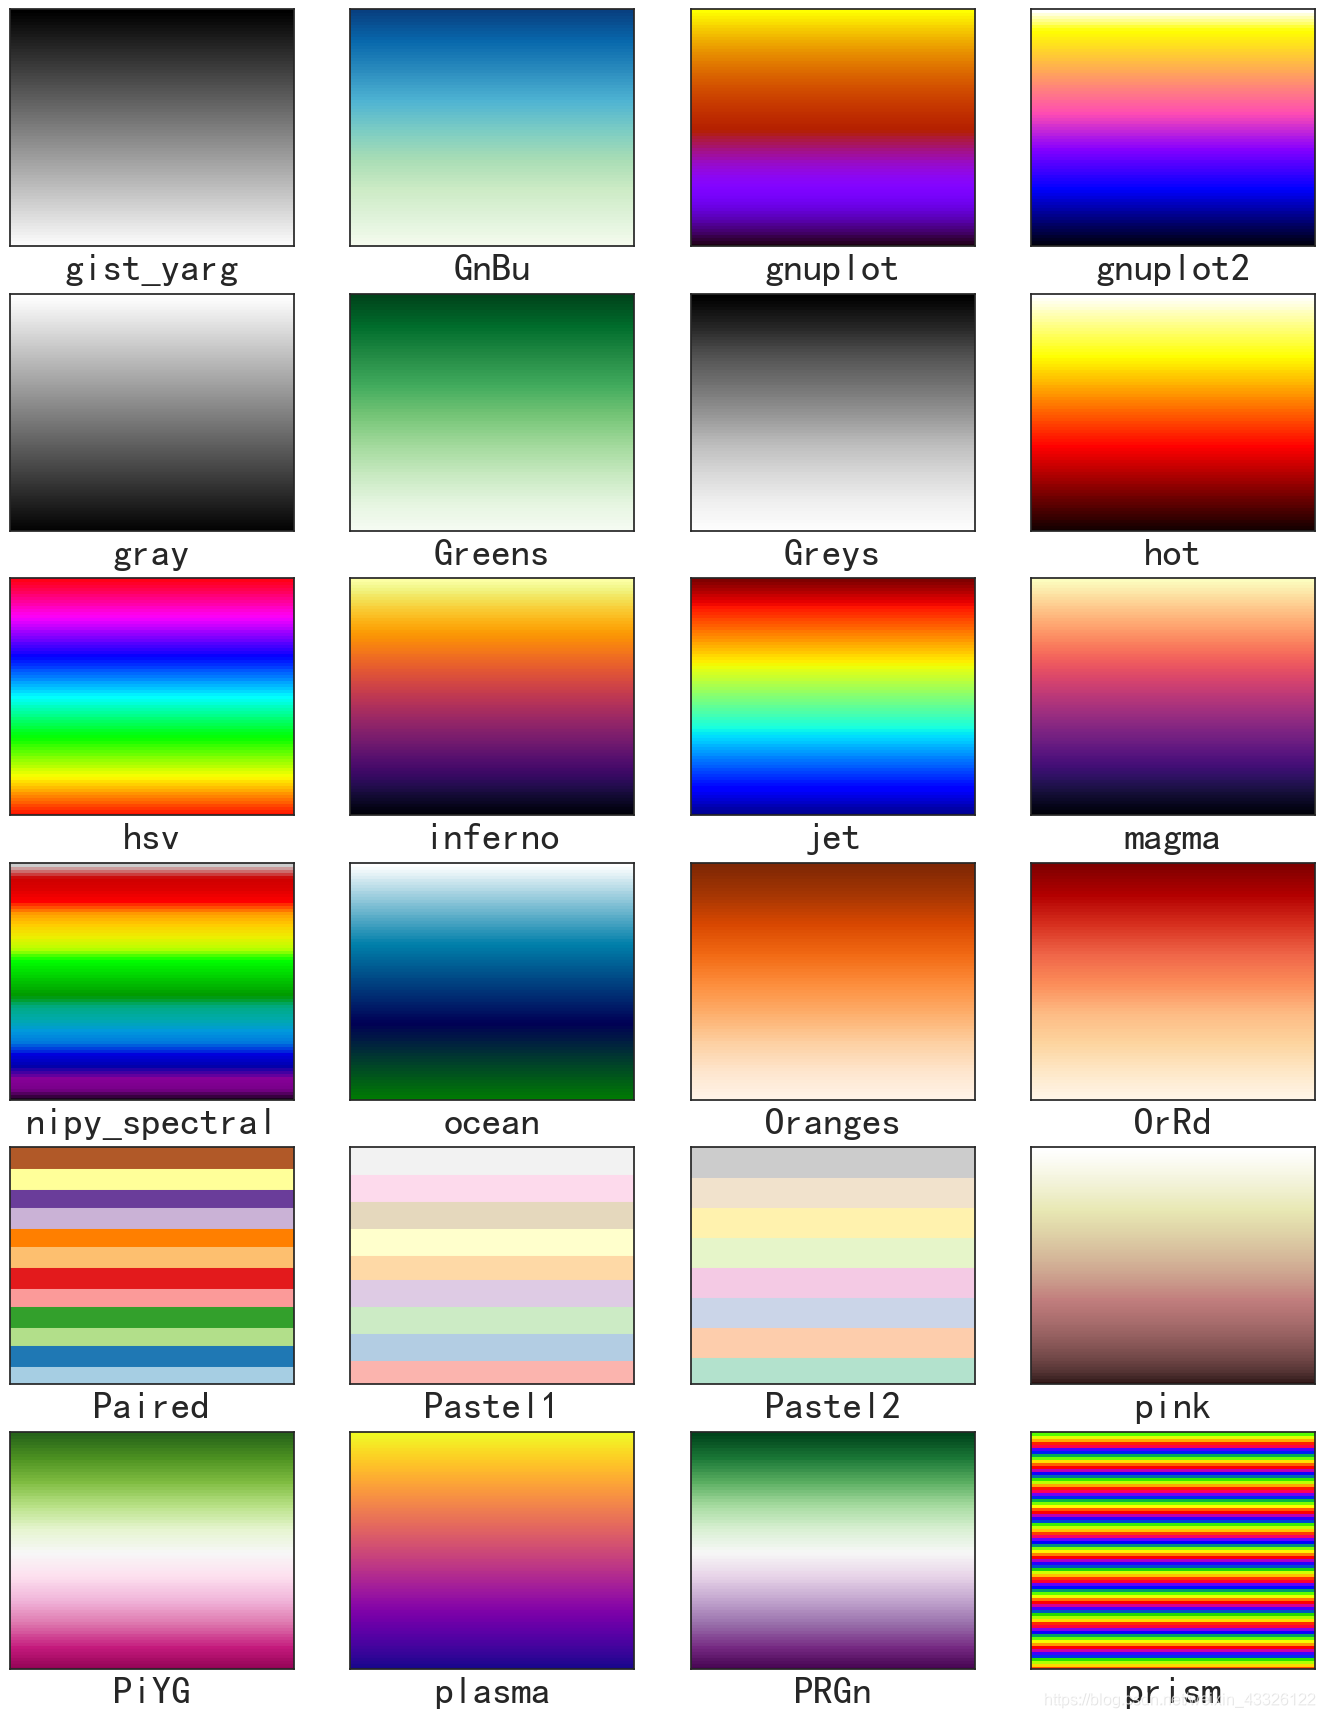
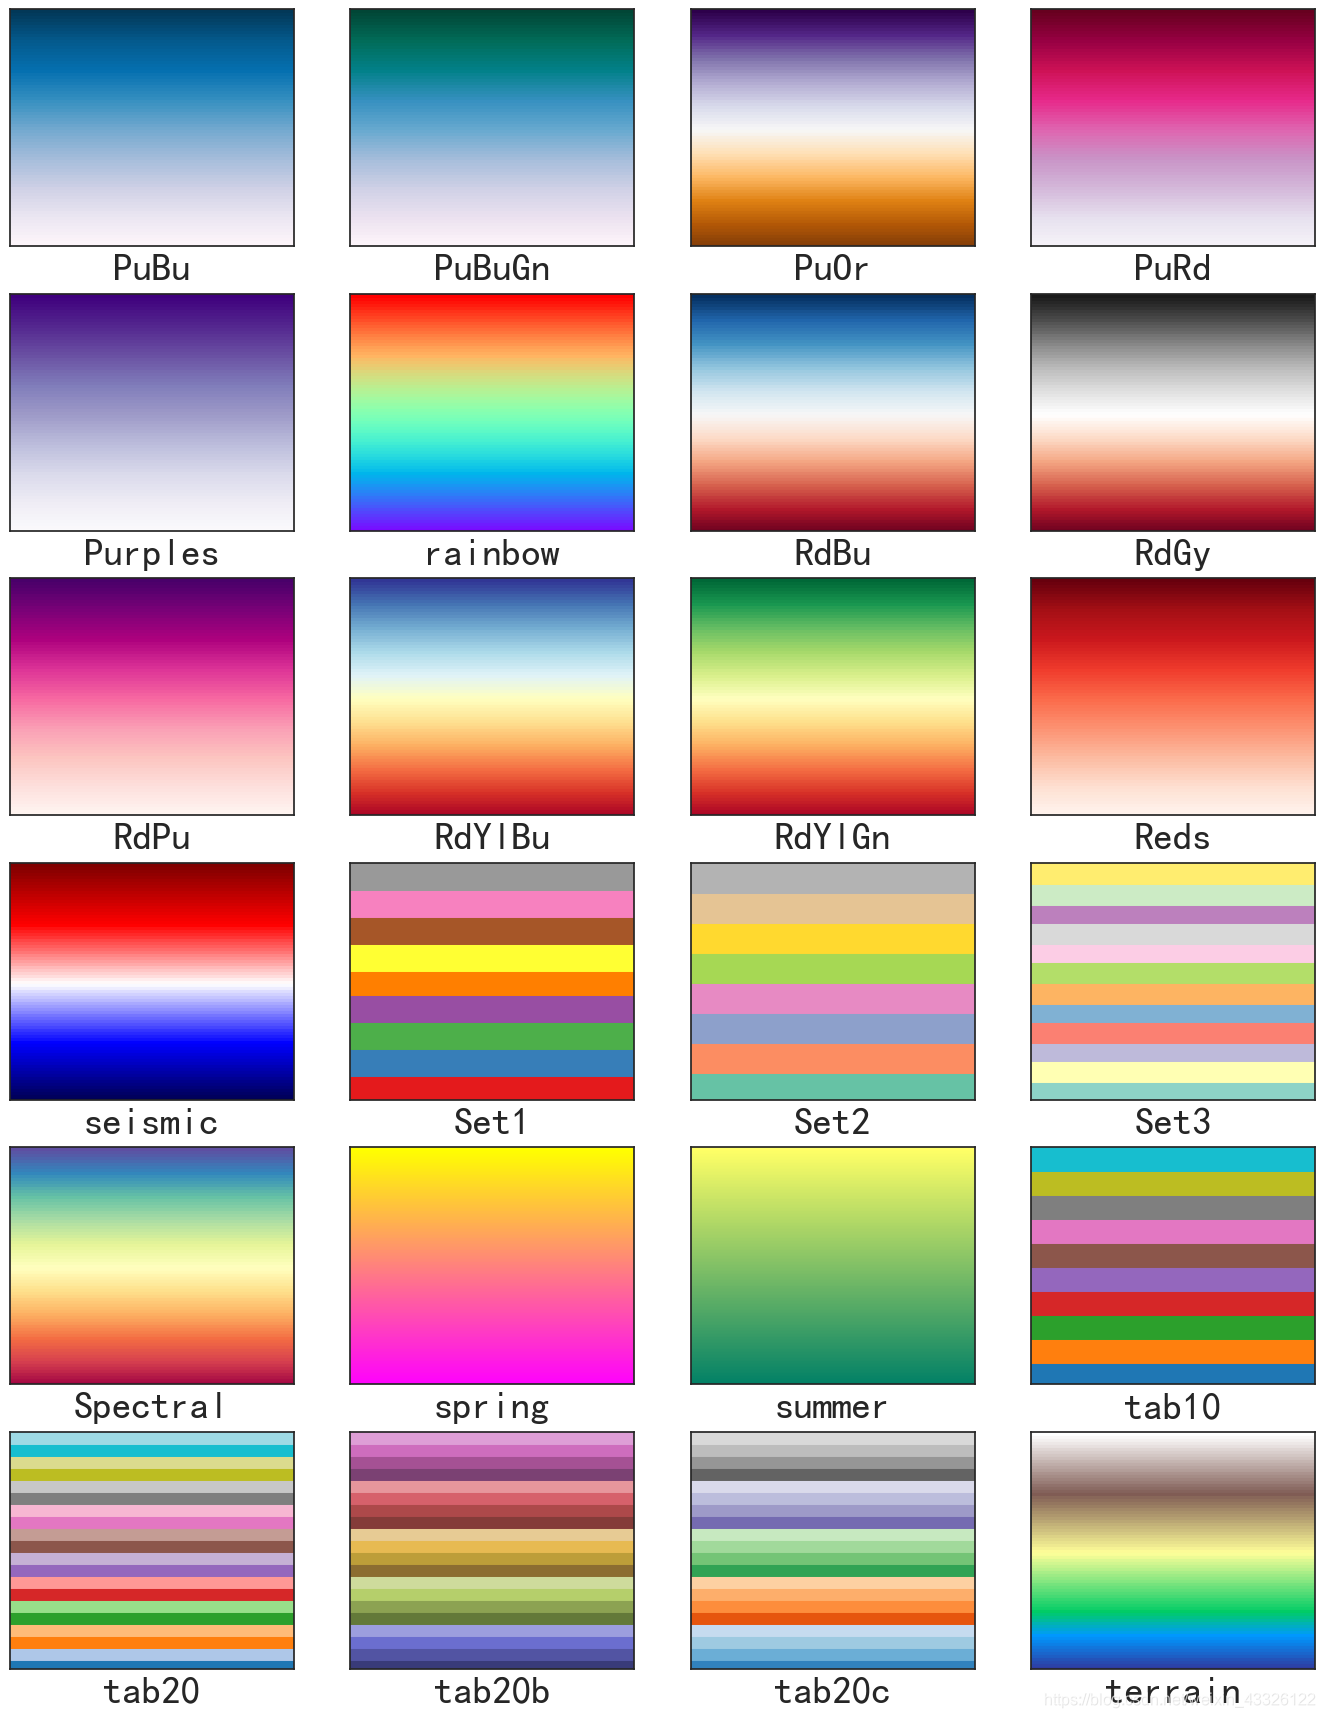
82种基本样式,每一种添加_r后可反转颜色,例如AccentAccent_r

常用备忘
Accent,Blues,BrBG,BuGn,BuPu,bwr,cividis,coolwarm,GnBu,Pastel1,Pastel2,RdBu,RdGy,RdYlBu,Set2,Set3,Spectral,tab20,twilight_shifted

获取方法
plt.colormaps()plt.cm._gen_cmap_d()

实现代码

def get_data(n):
    x = np.linspace(0, 10, n)
    y = np.zeros([n, n])
    for i in range(n):
        y[i, :] = list(map(lambda x:i, x))
    return x, y
    
t_count = 0
cm_ls = sorted(plt.colormaps(), key=str.lower)
cm_ls = [i for i in cm_ls if '_r' not in i]
page = 0
shape = (6, 4, 24)  # 横,纵,乘积
p = 80  # 间距
x, y = get_data(p)

while page * shape[2] < len(cm_ls):
    plt.figure(figsize=(15, 20))
    for i in range(1, shape[2] + 1):  
        if t_count >= len(cm_ls):
            break
        ax = plt.subplot(*shape[:2], i)

        cm_name = cm_ls[t_count]
        cm = plt.cm._gen_cmap_d()[cm_name]        
        cm = cm(np.linspace(0, 1, p))

        for n, i in enumerate(y):
            ax.plot(x, i, c=cm[n], lw=5)
        ax.set_xlabel(cm_name, fontsize=28)
        ax.set_xticks([])
        ax.set_yticks([])
        t_count += 1
    plt.savefig(r'C:\Users\Administrator\Desktop\%d.png' % (page+1), bbox_inches='tight', dpi=100)
    page += 1

在这里插入图片描述
在这里插入图片描述
在这里插入图片描述
在这里插入图片描述

### 关于词云 `colormap` 颜色样式Python 中使用 Matplotlib 和 WordCloud 库创建词云时,可以通过设置 `WordCloud` 对象的 `colormap` 参数来自定义颜色映射。这使得生成的词云不仅美观而且能够更好地表达数据特征。 #### 自定义颜色映射实例 下面是一个具体的例子,展示了如何利用不同类型的 colormap 来改变词云的颜色风格: ```python from wordcloud import WordCloud import matplotlib.pyplot as plt text = ("Colorful word clouds are amazing. " "They help to represent data visually and beautifully.") # 使用预设的颜色映射 'viridis' wordcloud_viridis = WordCloud(width=800, height=400, background_color='white', colormap='viridis').generate(text) plt.figure(figsize=(10, 5)) plt.imshow(wordcloud_viridis, interpolation='bilinear') plt.title("Viridis Colormap", fontsize=20) plt.axis('off') # 利用 LinearSegmentedColormap 类自定义 color_map from matplotlib.colors import LinearSegmentedColormap colors = ["red", "purple", "blue", "green"] custom_cmap = LinearSegmentedColormap.from_list(name="custom_colors", colors=colors) wordcloud_custom = WordCloud(width=800, height=400, background_color='white', colormap=custom_cmap).generate(text) plt.figure(figsize=(10, 5)) plt.imshow(wordcloud_custom, interpolation='bilinear') plt.title("Custom Colormap", fontsize=20) plt.axis('off') plt.show() ``` 上述代码片段分别采用了两种方式设置了词云的颜色:一种是直接应用了名为 `'viridis'` 的预设 colormap;另一种则是通过 `LinearSegmentedColormap` 构建了一个由红、紫、蓝、绿组成的渐变效果的自定义 colormap[^1][^2]。 #### 查看更多可用的颜色映射 为了探索更多的可能性,可以参考 Matplotlib 官方文档中的示例画廊,在那里可以看到各种各样的图表以及它们所使用的 colormap 效果图。此外,Matplotlib 还提供了超过一百七十种内置的颜色映射方案可供选择[^3][^4]。
评论
添加红包

请填写红包祝福语或标题

红包个数最小为10个

红包金额最低5元

当前余额3.43前往充值 >
需支付:10.00
成就一亿技术人!
领取后你会自动成为博主和红包主的粉丝 规则
hope_wisdom
发出的红包
实付
使用余额支付
点击重新获取
扫码支付
钱包余额 0

抵扣说明:

1.余额是钱包充值的虚拟货币,按照1:1的比例进行支付金额的抵扣。
2.余额无法直接购买下载,可以购买VIP、付费专栏及课程。

余额充值