


import numpy as np
import pandas as pd

X = np.array([[1.0, 0.0, 1.0, 0.0],
              [2.0, 0.0, 1.0, 0.0],
              [3.0, 0.0, 1.0, 0.0],
              [4.0, 0.0, 0.0, 1.0],
              [5.0, 1.0, 0.0, 0.0],
              [6.0, 0.0, 0.0, 1.0],
              [7.0, 1.0, 0.0, 0.0],
              [8.0, 0.0, 0.0, 1.0],
              [9.0, 1.0, 0.0, 0.0],
              [10.0, 0.0, 0.0, 1.0]])
transects = ['depth', 'substrate_coral', 'substrate_sand',
             'substrate_other']
sites = ['site1', 'site2', 'site3', 'site4', 'site5', 'site6', 'site7',
         'site8', 'site9', 'site10']
X = pd.DataFrame(X, sites, transects)

species = ['specie1', 'specie2', 'specie3', 'specie4', 'specie5',
           'specie6', 'specie7', 'specie8', 'specie9']
Y = np.array([[1, 0, 0, 0, 0, 0, 2, 4, 4],
              [0, 0, 0, 0, 0, 0, 5, 6, 1],
              [0, 1, 0, 0, 0, 0, 0, 2, 3],
              [11, 4, 0, 0, 8, 1, 6, 2, 0],
              [11, 5, 17, 7, 0, 0, 6, 6, 2],
              [9, 6, 0, 0, 6, 2, 10, 1, 4],
              [9, 7, 13, 10, 0, 0, 4, 5, 4],
              [7, 8, 0, 0, 4, 3, 6, 6, 4],
              [7, 9, 10, 13, 0, 0, 6, 2, 0],
              [5, 10, 0, 0, 2, 4, 0, 1, 3]])
Y = pd.DataFrame(Y, sites, species)

from skbio.stats.ordination import cca
del X['substrate_other']
ordination_result = cca(Y, X, scaling=2)
print(ordination_result )
这个是cca的,RDA跟他差不多
画图抄下面的
def plot_metrics(vals, ylabel, objective, xticks):
    with plt.style.context('ggplot'):
        plt.plot(xticks, np.array(vals), '-v', color='blue', mfc='blue')
        if objective=='min':
            idx = np.argmin(vals)
        else:
            idx = np.argmax(vals)
        plt.plot(xticks[idx], np.array(vals)[idx], 'P', ms=10, mfc='red')
        plt.xlabel('Number of CCA components')
        plt.xticks = xticks
        plt.ylabel(ylabel)
        plt.title('CCA')
    plt.show()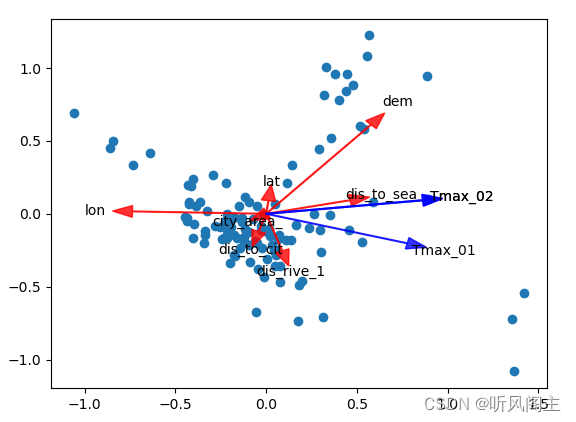
后面想怎么调就怎么调呗,反正是骂他普劳特画的


 975
975


 被折叠的 条评论
为什么被折叠?
被折叠的 条评论
为什么被折叠?
 到【灌水乐园】发言


