


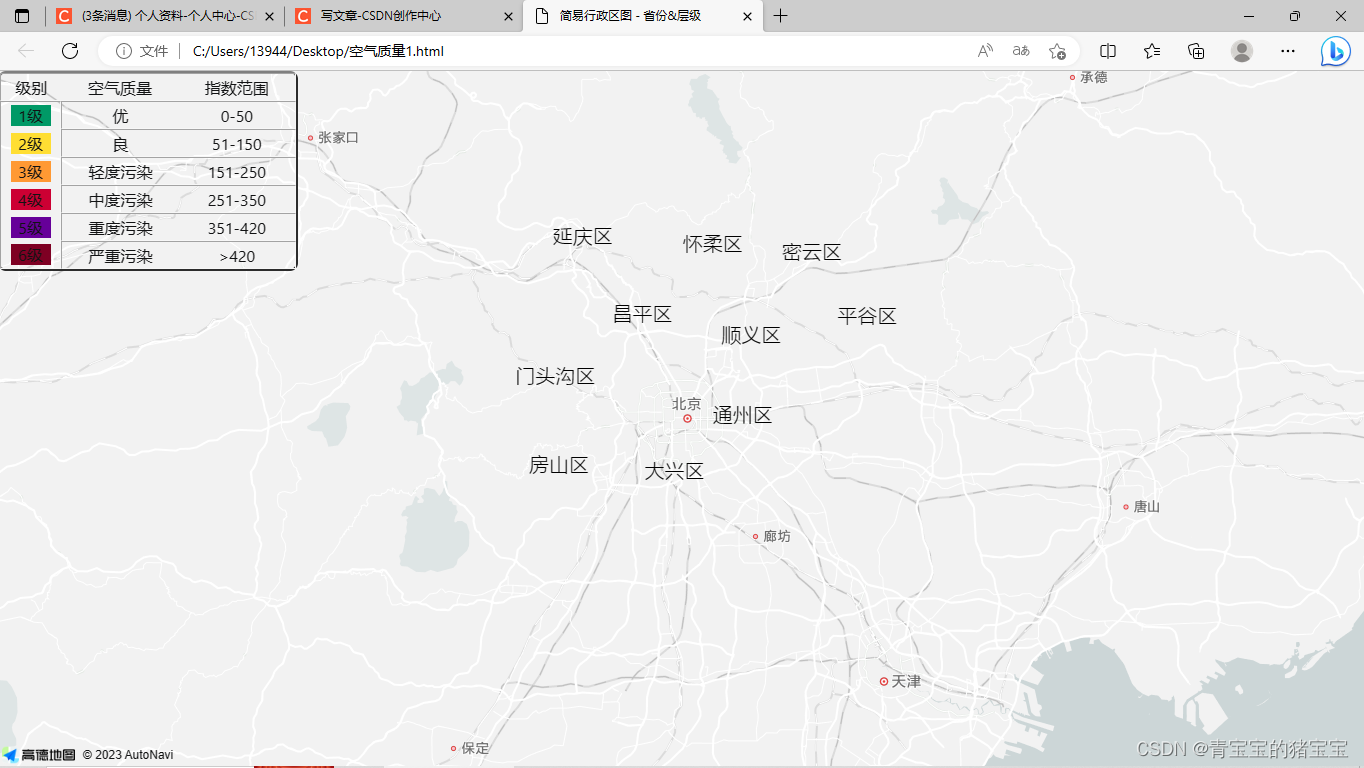
效果展示:(图中表格靠左显示在了地图的上方)
1、首先要用到position,z-Indext两个属性。
2、将div,table的position属性都设置为absolute。将表格的z-Index属性值设置的比div高;
<div id="container" style="z-Index:1;position:absolute" overflow:hidden></div>
<table border="2px" width="300px" height="200px" align="center" cellspacing="0"
        style="border-radius:8px;text-align:center;z-Index:2;position:absolute">
3、完整代码:
<html lang="en">

<head>
    <meta charset="utf-8">
    <meta http-equiv='X-UA-Compatible' content='IE=edge'>
    <meta name="viewport" content="initial-scale=1.0, user-scalable=no, width=device-width">
    <link rel="stylesheet" href="https://a.amap.com/jsapi_demos/static/demo-center/css/demo-center.css" />
    <style>
        #container {
            width: 100%;
            height: 100%;
            margin: 0;
        }
        .AQ{
        border-right:0
        }
        .number{
        border-left:0
        }
        .rank{
        border-top:0;
        border-bottom:0;
        }
        td{
        border-color:#f7f7f7;
        }
        .nr-dashboard-template.visible{
       overflow:hidden;
        }
    </style>
    <title>简易行政区图 - 省份&层级</title>
</head>

<body>
    <div id="container" style="z-Index:1;position:absolute" overflow:hidden></div>
<table border="2px" width="300px" height="200px" align="center" cellspacing="0"
        style="border-radius:8px;text-align:center;z-Index:2;position:absolute">
        <tr>
            <td style="border-right:0">级别</td>
            <td style="border-left:0; border-right:0">空气质量</td>
            <td class="number">指数范围</td>
        </tr>
        <tr>
            <td style="border-bottom:0; ">
                <p style="background-color:#009966!important; width:70%;margin-left:15%">1级</p>
            </td>
            <td class="AQ">优</td>
            <td class="number">0-50</td>
        </tr>
        <tr>
            <td class="rank">
                <p style="background-color:#ffde33!important; width:70%;margin-left:15%">2级</p>
            </td>
            <td class="AQ">良</td>
            <td class="number">51-150</td>
        </tr>
        <tr>
            <td class="rank">
                <p style="background-color:#ff9933!important; width:70%;margin-left:15%">3级</p>
            </td>
            <td class="AQ">轻度污染</td>
            <td class="number">151-250</td>
        </tr>
        <tr>
            <td class="rank">
                <p style="background-color:#cc0033!important; width:70%;margin-left:15%">4级</p>
            </td>
            <td class="AQ">中度污染</td>
            <td class="number">251-350</td>
        </tr>
        <tr>
            <td class="rank">
                <p style="background-color:#660099!important; width:70%;margin-left:15%">5级</p>
            </td>
            <td class="AQ">重度污染</td>
            <td class="number">351-420</td>
        </tr>
        <tr>
            <td style="border-top:0;">
                <p style="background-color:#7e0023!important; width:70%;margin-left:15%">6级</p>
            </td>
            <td class="AQ">严重污染</td>
            <td class="number">>420</td>
        </tr>
    </table>
    <script
        src="https://webapi.amap.com/maps?v=2.0&key=3da7e95c620babc212c1c24a3a509896&plugin=AMap.Scale,AMap.ToolBar">
    </script>
    <script src="https://a.amap.com/Loca/static/mock/adcodes.js"></script>

    <script>
        var map = new AMap.Map("container", {
        zoom: 11,//地图打开时缩放级别
        center: [116.39199256, 40.0270229],//起始显示的中心位置
        viewMode: '3D',//引入2D地图
        mapStyle: 'amap://styles/whitesmoke'//设置地图显示模式
        });

        textMaker("门头沟区",[115.87420227,40.01922484]);

        textMaker("房山区",[115.88929078,39.74626607]);

        textMaker("通州区",[116.63120269,39.89946490]);

        textMaker("顺义区",[116.66587829,40.14791366]);

        textMaker("昌平区",[116.22711181,40.21244075]);

        textMaker("大兴区",[116.35620117,39.72620105]);

        textMaker("怀柔区",[116.51008544,40.42790667]);

        textMaker("平谷区",[117.13485717,40.20538673]);

        textMaker("密云区",[116.91101074,40.40270516]);

        textMaker("延庆区",[115.98541259,40.45112732]);

    function textMaker(district,lonAla){//设置各区文本标记
    var text = new AMap.Text({
    text:district,
    anchor:'center', // 设置文本标记锚点
    style:{
    'padding': '.75rem 1.25rem',
    'margin-bottom': '1rem',
    'border-radius': '.25rem',
    'background-color': 'rgba(0,0,0,0)',
    'width': '15rem',
    'border-width': 0,
    'text-align': 'center',
    'font-size': '20px',
    'color': 'black'
    },
    position:lonAla//文本标记的位置经纬度
    });
    text.setMap(map);
    }
    </script>
</body>

</html>


 734
734


 被折叠的 条评论
为什么被折叠?
被折叠的 条评论
为什么被折叠?
 到【灌水乐园】发言


