


首先附上vue-flow官方文档:https://vueflow.dev/
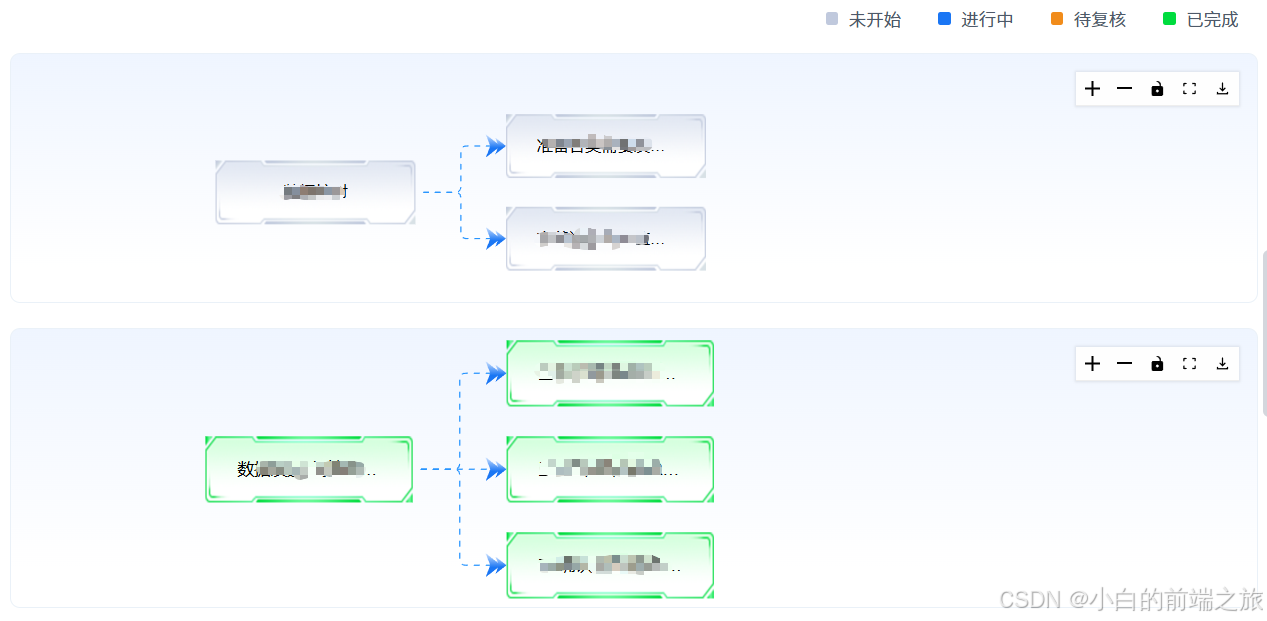
实现的效果图如下:
双层箭头这里是用svg写的,不会写的童鞋可以问公司ui要或者上蓝湖之类的一些平台自己画,然后导出
1. 背景介绍:流程数据来自接口请求,由于数据为动态的,所以节点的坐标需要计算,计算方式为:
x坐标:节点层级*节点宽度+节点横向间隔 ;
y坐标:节点层级*节点高度+节点纵向间隔
2. 自定义连接线和markerEnd:
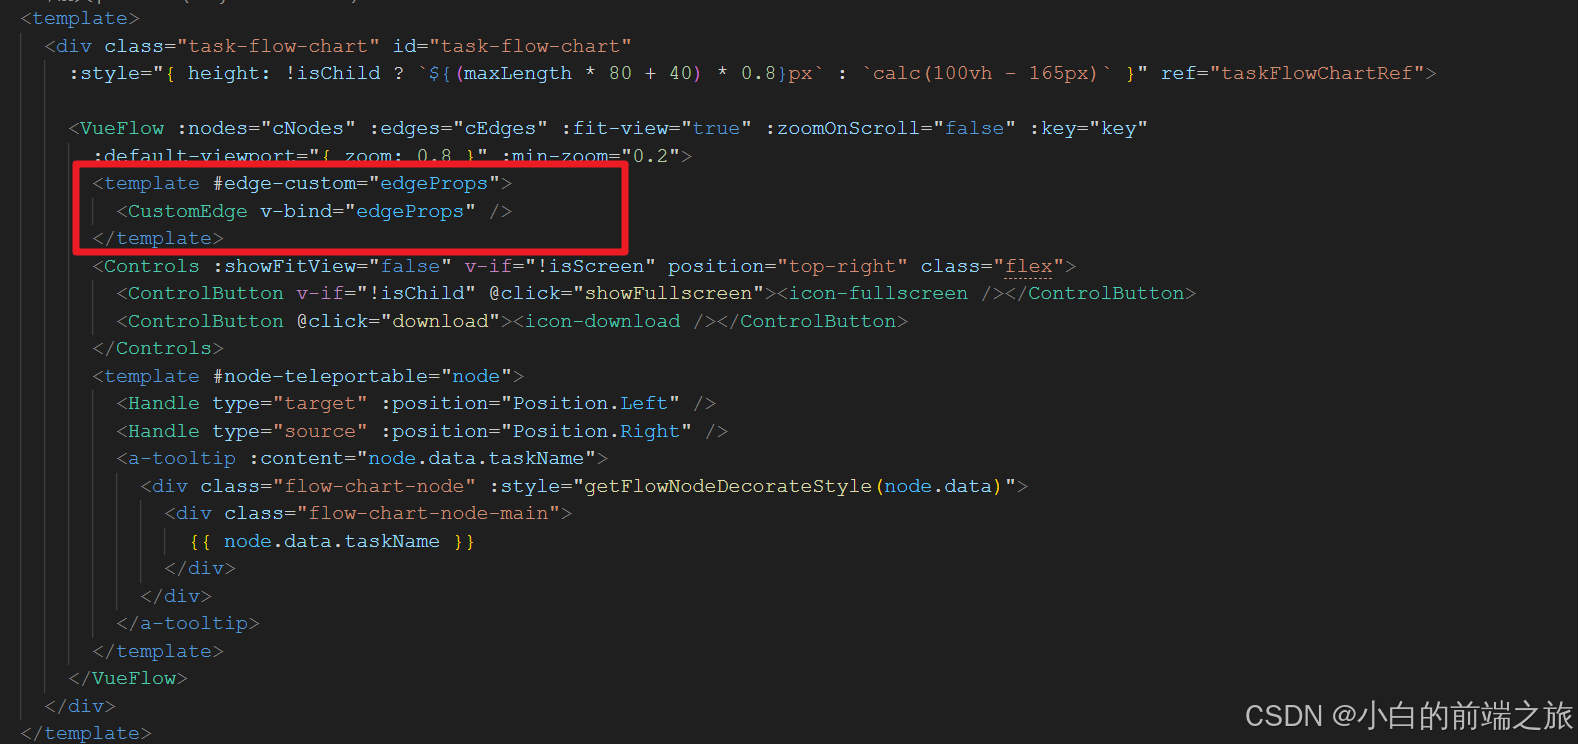
全部代码:
<template>
<div class="task-flow-chart" id="task-flow-chart"
:style="{ height: !isChild ? `${(maxLength * 80 + 40) * 0.8}px` : `calc(100vh - 165px)` }" ref="taskFlowChartRef">
<VueFlow :nodes="cNodes" :edges="cEdges" :fit-view="true" :zoomOnScroll="false" :key="key"
:default-viewport="{ zoom: 0.8 }" :min-zoom="0.2">
<template #edge-custom="edgeProps">
<CustomEdge v-bind="edgeProps" />
</template>
<Controls :showFitView="false" v-if="!isScreen" position="top-right" class="flex">
<ControlButton v-if="!isChild" @click="showFullscreen"><icon-fullscreen /></ControlButton>
<ControlButton @click="download"><icon-download /></ControlButton>
</Controls>
<template #node-teleportable="node">
<Handle type="target" :position="Position.Left" />
<Handle type="source" :position="Position.Right" />
<a-tooltip :content="node.data.taskName">
<div class="flow-chart-node" :style="getFlowNodeDecorateStyle(node.data)">
<div class="flow-chart-node-main">
{{ node.data.taskName }}
</div>
</div>
</a-tooltip>
</template>
</VueFlow>
</div>
</template>
<script lang="ts" setup>
import CustomEdge from './CustomEdge.vue'
import { ref, watch, type PropType } from 'vue'
import { VueFlow, Handle } from '@vue-flow/core'
import { MarkerType, Position } from '@vue-flow/core'
import { ControlButton, Controls } from '@vue-flow/controls'
import type { TaskTreeItem } from '@/types/task'
import '@vue-flow/controls/dist/style.css'
import html2canvas from 'html2canvas'
import { nextTick } from 'vue'
import CompleteStatusLogo0 from '@/assets/images/common/complete-status-0.png'
import CompleteStatusLogo1 from '@/assets/images/common/complete-status-1.png'
import CompleteStatusLogo2 from '@/assets/images/common/complete-status-2.png'
import CompleteStatusLogo3 from '@/assets/images/common/complete-status-3.png'
interface CNode {
id: string
type: string
class: string
position: { x: number; y: number }
data: TaskTreeItem
level: number
parentId: string
}
const props = defineProps({
options: {
type: Object as PropType<TaskTreeItem>,
default: () => { }
},
isChild: {
type: Boolean,
default: false
}
})
const emits = defineEmits<{ preview: [id: string] }>()
const taskFlowChartRef = ref()
const cNodes = ref<CNode[]>([])
const cEdges = ref<
{
id: string
type: string
source: string
target: string
markerEnd: string
animated: boolean
style?: any
}[]
>([])
const maxLevel = ref<number>(-1)
const maxLength = ref<number>(-1)
const loadFlowChart = (options: TaskTreeItem, parentId?: string, level = 0) => {
cNodes.value.push({
id: options.id,
type: 'teleportable',
class: 'light',
parentId: parentId || '0',
position: {
x: 80 + level * 251,
y: 0
},
data: options,
level
})
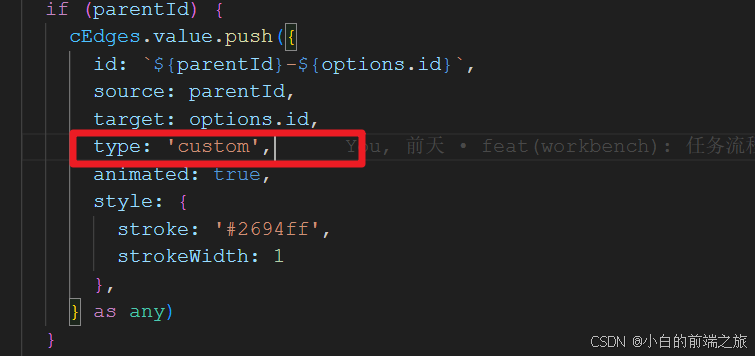
if (parentId) {
cEdges.value.push({
id: `${parentId}-${options.id}`,
source: parentId,
target: options.id,
type: 'custom',
animated: true,
style: {
stroke: '#2694ff',
strokeWidth: 1
},
} as any)
}
maxLevel.value = Math.max(maxLevel.value, level)
if (options.children && options.children.length > 0) {
for (let i = 0; i < options.children.length; i++) {
loadFlowChart(options.children[i], options.id, level + 1)
}
}
}
function reorderItemsByY(items: CNode[]): CNode[] {
const hasYList: CNode[] = []
for (let item of items) {
if (!hasYList.some((el) => el.parentId === item.parentId) && item.position.y) {
hasYList.push(item)
}
}
let newItems: CNode[] = []
for (let hasY of hasYList) {
newItems = [
...newItems,
hasY,
...items.filter((el) => el.parentId === hasY.parentId && el.id !== hasY.id)
]
}
newItems = [
...newItems,
...items.filter(
(el) => !hasYList.some((hasY) => hasY.id === el.id || hasY.parentId === el.parentId)
)
]
return newItems
}
const formatNodeY = () => {
let newList: CNode[] = []
const maxLevelList = cNodes.value.filter((el) => el.level === maxLevel.value)
maxLength.value = maxLevelList.length
for (let i = 0; i < maxLevelList.length; i++) {
maxLevelList[i].position.y = 20 + i * 80
}
for (let i = maxLevel.value - 1; i >= 0; i--) {
let currentLevelList = cNodes.value.filter((el) => el.level === i)
maxLength.value = Math.max(maxLength.value, currentLevelList.length)
for (let j = 0; j < currentLevelList.length; j++) {
// 平均分配布局
// const gap = ((maxLevelList.length - 1) * 80 + 72 - currentLevelList.length * 72) / (currentLevelList.length + 1)
// currentLevelList[j].position.y = 20 + gap + (gap + 72) * j
// 跟着子集对齐
const childList = [
...maxLevelList.filter((el) => el.parentId === currentLevelList[j].id),
...newList.filter((el) => el.parentId === currentLevelList[j].id)
]
if (childList.length > 0) {
currentLevelList[j].position.y =
childList
.map((row) => row.position.y)
.reduce((perviousValue, currentValue) => perviousValue + currentValue) /
childList.length
}
}
// 找有高度的元素,然后将和他拥有共同父级的元素传送到它身后
// const newCurrentList = []
currentLevelList = reorderItemsByY(currentLevelList)
for (let j = 0; j < currentLevelList.length; j++) {
const childList = [
...maxLevelList.filter((el) => el.parentId === currentLevelList[j].id),
...newList.filter((el) => el.parentId === currentLevelList[j].id)
]
if (childList.length === 0) {
currentLevelList[j].position.y =
Math.max(...currentLevelList.map((row) => row.position.y)) > 0
? Math.max(...currentLevelList.map((row) => row.position.y)) + 80
: 20 // 找y最大的 + 80
}
}
newList.push(...currentLevelList)
}
cNodes.value = [...newList, ...maxLevelList]
}
const getFlowNodeDecorateStyle = (item: TaskTreeItem) => {
const bgMap = {
'0': CompleteStatusLogo0,
'1': CompleteStatusLogo1,
'2': CompleteStatusLogo2,
'3': CompleteStatusLogo3,
'5': CompleteStatusLogo0
}
return {
backgroundImage: `url('${bgMap[item.taskCompleteStatus]}')`
}
}
const key = ref(-1)
watch(
props.options,
(val) => {
cNodes.value.length = 0
cEdges.value.length = 0
loadFlowChart(val)
formatNodeY()
setTimeout(() => {
key.value++
}, 300)
},
{ deep: true, immediate: true }
)
const showFullscreen = () => {
emits('preview', props.options.id)
}
const isScreen = ref<boolean>(false)
const download = () => {
if (taskFlowChartRef.value) {
isScreen.value = true
console.time()
nextTick(() => {
html2canvas(taskFlowChartRef.value)
.then((canvas) => {
// 将canvas转换为图片
const image = canvas.toDataURL('image/png')
// 创建一个a标签用于下载
const link = document.createElement('a')
link.href = image
link.download = '流程图.png'
// 自动触发下载
link.click()
isScreen.value = false
})
.catch((error) => {
console.error('Error capturing div:', error)
})
})
}
}
</script>
<style lang="less" scoped>
.task-flow-chart {
min-height: 200px;
margin-bottom: 20px;
font-family: Arial;
background: linear-gradient(180deg, #EFF5FF 0%, #FFFFFF 86%);
border-radius: 8px;
border: 1px solid #EAF1F8;
.vue-flow {
height: 100%;
width: 100%;
overflow: hidden;
}
.flow-chart-node {
width: 173px;
height: 55px;
display: flex;
align-items: center;
justify-content: center;
overflow: hidden;
background-size: 100% 100%;
.flow-chart-node-main {
max-width: 120px;
overflow: hidden;
text-overflow: ellipsis;
white-space: nowrap;
font-size: 14px;
}
}
}
</style>CustomEdge.vue
<script setup>
import { BaseEdge, getSmoothStepPath, useVueFlow } from '@vue-flow/core'
import { computed } from 'vue'
import CustomMarker from './CustomMarker.vue'

const props = defineProps({
  id: {
    type: String,
    required: true,
  },
  sourceX: {
    type: Number,
    required: true,
  },
  sourceY: {
    type: Number,
    required: true,
  },
  targetX: {
    type: Number,
    required: true,
  },
  targetY: {
    type: Number,
    required: true,
  },
  sourcePosition: {
    type: String,
    required: true,
  },
  targetPosition: {
    type: String,
    required: true,
  },
  source: {
    type: String,
    required: true,
  },
  target: {
    type: String,
    required: true,
  },
  data: {
    type: Object,
    required: false,
  },
  stroke: {
    type: String,
    required: false,
    default: '#2694ff', // 默认颜色
  },
})

const { findNode } = useVueFlow()

const path = computed(() => getSmoothStepPath(props))

const markerId = computed(() => `${props.id}-marker`)
</script>

<script>
export default {
  inheritAttrs: false,
}
</script>

<template>
  <BaseEdge :id="id" :path="path[0]" :marker-end="`url(#${markerId})`" :label-x="path[1]" :label-y="path[2]"
    label-bg-style="fill: whitesmoke" :style="{ stroke: stroke }" />
  <CustomMarker :id="markerId" :stroke-width="2" :width="20" :height="20" />
</template>
CustomMarker.vue
双层箭头这里是用svg写的,不会写的童鞋可以问公司ui要或者上蓝湖之类的一些平台自己画,然后导出
<script setup>
defineProps({
  id: {
    type: String,
    required: true,
  },
  width: {
    type: Number,
    required: false,
    default: 14,
  },
  height: {
    type: Number,
    required: false,
    default: 16,
  },
})
</script>

<template>
  <svg class="vue-flow__marker vue-flow__container">
    <defs>
      <marker :id="id" class="vue-flow__arrowhead" viewBox="0 0 14 16" refX="12" refY="8" :markerWidth="width"
        :markerHeight="height" markerUnits="strokeWidth" orient="auto-start-reverse">
        <defs>

          <linearGradient id="linear-gradient" x1="870.313" y1="419.719" x2="870.313" y2="408.281"
            gradientUnits="userSpaceOnUse">
            <stop offset="0" stop-color="#1a76f4" />
            <stop offset="0.405" stop-color="#1a76f4" />
            <stop offset="1" stop-color="#cae0ff" />
          </linearGradient>
          <linearGradient id="linear-gradient-2" x1="865.156" y1="422" x2="865.156" y2="406"
            xlink:href="#linear-gradient" />
        </defs>
        <path id="多边形_1880" data-name="多边形 1880" fill="url(#linear-gradient)"
          d="M866.639,419.705l7.354-5.715-7.354-5.715s2.211,5.693,2.211,5.733S866.639,419.705,866.639,419.705Z"
          transform="translate(-860 -406)" />
        <path id="多边形_1880_拷贝" data-name="多边形 1880 拷贝" fill="url(#linear-gradient-2)"
          d="M860.011,421.99l10.3-8-10.3-8s3.094,7.97,3.094,8.026C863.105,414.055,860.011,421.99,860.011,421.99Z"
          transform="translate(-860 -406)" />
      </marker>
    </defs>
  </svg>
</template>

<style scoped>
.vue-flow__marker {
  position: absolute;
  width: 0;
  height: 0;
}
</style>


 707
707

 被折叠的 条评论
为什么被折叠?
被折叠的 条评论
为什么被折叠?
 到【灌水乐园】发言


