


背景
业务场景体现在功能层面主要两点,
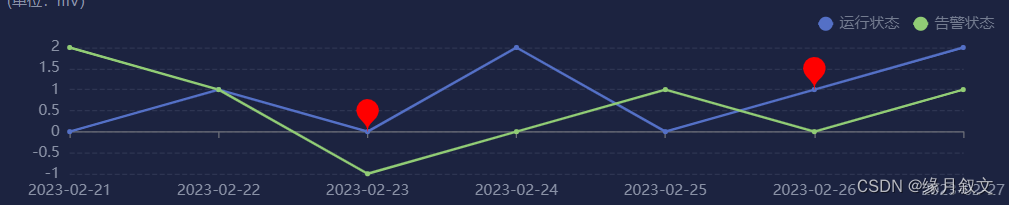
- 折线图表设置点击事件
- 点击事件与图标渲染标记绑定
对于节点没有被添加标记的可以,弹框提示添加标记,并提供标记内容输入框,已经添加过标记的点,点击直接显示标记内容
一、代码示例
dom
  <div class="chartbox-dom"
               ref="voltageLineRef"></div>
标记弹窗
  <!-- 标记弹窗 -->
  <el-dialog v-model="dialogVisible"
             :title="dialogTitle"
             width="300">
    <div v-if="dialogTitle == '添加标记'">
      <p style="padding-bottom: 10px;font-size: 14px;color:#E6E6E6;">标记内容:</p>
      <el-input v-model="tagContent"
                :rows="2"
                type="textarea"
                placeholder="请输入标记内容" />
    </div>
    <div style="font-size: 14px;color:#E6E6E6;"
         v-else>
      {{ tagContent }}
    </div>
    <template #footer>
      <div>
        <el-button @click="handleClose">关闭</el-button>
        <el-button type="primary"
                   v-if="dialogTitle == '添加标记'"
                   @click="confirm">
          保存
        </el-button>
      </div>
    </template>
  </el-dialog>
逻辑:
import * as echarts from 'echarts'

const tagContent = ref('') //弹窗内容
const markPointData = reactive({
  y0: [
    {
      coord: [2, 0],
      name: '标记内容自定义1',
    },
    {
      coord: [5, 1],
      name: '标记内容自定义2',
    },
  ], // 标记内容
  y1: [],
})
const dialogVisible = ref(false) //控制弹窗
const coordValue = ref([]) //坐标
const dialogTitle = ref('添加标记')
const seriesIndex = ref(0) //折线图索引


//曲线
function voltageLineDraw() {
  let voltageLineChart = echarts.init(voltageLineRef.value)
  voltageLineChart.group = 'echartGroup'
  let option = {
    tooltip: {
      trigger: 'axis',
      backgroundColor: 'rgba(16,28,55,0.9)',
      textStyle: {
        color: '#fff',
      },
      axisPointer: {
        type: 'cross',
      },
      formatter: function (params) {
        var result = params[0].name + '<br/>'
        params.forEach(function (item) {
          var value = item.data
          var status
          if (value == 0) {
            status = '低'
          } else if (value == 1) {
            status = '中'
          } else {
            status = '高'
          }
          var color = item.color // 获取折线的颜色
          result += `
                        <div style="display: flex; align-items: center;">
                            <span style="display: inline-block; width: 10px; height: 10px; background-color:${color}; border-radius: 50%; margin-right: 5px;"></span>
                            ${item.seriesName}: ${status}
                        </div>
                        `
        })
        return result
      },
    },
    legend: {
      top: 0,
      right: 10,
      itemWidth: 12, // 图例标记的图形宽度
      itemHeight: 14, // 图例标记的图形高度
      textStyle: {
        color: '#747C90',
      },
      data: ['运行状态', '告警状态'],
    },
    grid: {
      top: 30,
      left: 20,
      right: 40,
      bottom: 10,
      containLabel: true,
    },
    xAxis: {
      type: 'category',
      boundaryGap: false,
      axisLabel: {
        color: '#8A92A6',
      },
      data: [
        '2023-02-21',
        '2023-02-22',
        '2023-02-23',
        '2023-02-24',
        '2023-02-25',
        '2023-02-26',
        '2023-02-27',
      ],
    },
    yAxis: {
      type: 'value',
      axisLabel: {
        color: '#8A92A6',
      },
      splitLine: {
        // 网格线
        show: true,
        lineStyle: {
          //分割线
          color: '#2E3552',
          width: 1,
          type: 'dashed', //dotted:虚线 solid:实线
        },
      },
    },
    dataZoom: [
      {
        show: false,
        realtime: true,
        xAxisIndex: 'all',
      },
      {
        type: 'inside',
        realtime: true,
        show: false,
        xAxisIndex: 'all',
      },
    ],
    series: [
      {
        name: '运行状态',
        type: 'line',
        symbol: 'circle',
        data: [0, 1, 0, 2, 0, 1, 2],
        markPoint: {
          data: markPointData.y0,
          symbolSize: 30,
          itemStyle: {
            color: 'red',
          },
          label: {
            fontSize: 10,
            color: '#fff',
          },
        },
      },
      {
        name: '告警状态',
        type: 'line',
        symbol: 'circle',
        data: [2, 1, -1, 0, 1, 0, 1],
        markPoint: {
          data: markPointData.y1,
          symbolSize: 30,
          itemStyle: {
            color: 'red',
          },
          label: {
            fontSize: 10,
            color: '#fff',
          },
        },
      },
    ],
  }
  voltageLineChart.setOption(option)
  voltageLineChart.off('click') //处理点击重复问题
  voltageLineChart.on('click', (params) => {
    switch (params.componentType) {
      case 'markPoint':
        tagContent.value = params.data.name
        openDialog('标记内容', params.dataIndex, params.value)
        break
      case 'series':
        tagContent.value = ''
        openDialog('添加标记', params.dataIndex, params.value)
        break
    }
    seriesIndex.value = params.seriesIndex
    dialogVisible.value = true
  })
  echarts.connect('echartGroup')
  window.addEventListener('resize', () => {
    voltageLineChart.resize()
  })
}

/* 打开弹窗 */
function openDialog(title, index, value) {
  dialogTitle.value = title
  coordValue.value = [index, value]
  dialogVisible.value = true
}
/* 弹窗关闭 */
function handleClose() {
  tagContent.value = ''
  dialogVisible.value = false
}
/* 弹窗确定 */
function confirm() {
  const hasCoordIndex = markPointData['y' + seriesIndex.value].findIndex(
    (num) => num.coord[0] == coordValue.value[0]
  )
  if (hasCoordIndex == -1) {
    markPointData['y' + seriesIndex.value].push({
      coord: coordValue.value,
      name: tagContent.value,
    })
  } else {
    markPointData['y' + seriesIndex.value].splice(hasCoordIndex, 1, {
      coord: coordValue.value,
      name: tagContent.value,
    })
  }
  voltageLineDraw()
  dialogVisible.value = false
}


 467
467

 被折叠的 条评论
为什么被折叠?
被折叠的 条评论
为什么被折叠?
 到【灌水乐园】发言


