


Actuator监控介绍
Actuator是Spring Boot自带的监控功能,可以帮助实现对程序内部运行情况的监控,如监控状况、Bean加载情况,配置属性,日志信息等。
Actuator监控
快速使用
- 首先使用idea快速搭建一个web项目
- pom.xml文件中应该至少有这两个依赖
	<dependency>
        <groupId>org.springframework.boot</groupId>
        <artifactId>spring-boot-starter-actuator</artifactId>
    </dependency>
    <dependency>
        <groupId>org.springframework.boot</groupId>
        <artifactId>spring-boot-starter-web</artifactId>
    </dependency>
- 启动项目
- 因为在不指定端口x号的话,默认是8080端口,所以直接访问http://localhost:8080/actuator就可以了
- 运行结果是一堆json字符串,经过浏览器插件整理后这样展示
{
    "_links": {
        "self": {
            "href": "http://localhost:8080/actuator",
            "templated": false
        },
        "health-component": {
            "href": "http://localhost:8080/actuator/health/{component}",
            "templated": true
        },
        "health-component-instance": {
            "href": "http://localhost:8080/actuator/health/{component}/{instance}",
            "templated": true
        },
        "health": {
            "href": "http://localhost:8080/actuator/health",
            "templated": false
        },
        "info": {
            "href": "http://localhost:8080/actuator/info",
            "templated": false
        }
    }
}
这个json字符串显示的每一个对象都是一个地址,我们可以通过访问去看所对应的详细信息
比如http://localhost:8080/actuator/health可以看当前程序的状态
up是程序正常运行
down是程序出现异常
{
    "status": "UP"
}
虽然展示的数据比较简单,甚至可以说得不到什么具体信息,但是我们可以通过配置达到详细信息的展示
打开Spring Boot的配置文件在里面写入这两句话
#显示详细信息
management.endpoint.health.show-details=always
#加载所有信息
management.endpoints.web.exposure.include=*
重启项目后的运行结果
{
    "_links": {
        "self": {
            "href": "http://localhost:8080/actuator",
            "templated": false
        },
        "auditevents": {
            "href": "http://localhost:8080/actuator/auditevents",
            "templated": false
        },
        "beans": {
            "href": "http://localhost:8080/actuator/beans",
            "templated": false
        },
        "caches-cache": {
            "href": "http://localhost:8080/actuator/caches/{cache}",
            "templated": true
        },
        "caches": {
            "href": "http://localhost:8080/actuator/caches",
            "templated": false
        },
        "health": {
            "href": "http://localhost:8080/actuator/health",
            "templated": false
        },
        "health-component": {
            "href": "http://localhost:8080/actuator/health/{component}",
            "templated": true
        },
        "health-component-instance": {
            "href": "http://localhost:8080/actuator/health/{component}/{instance}",
            "templated": true
        },
        "conditions": {
            "href": "http://localhost:8080/actuator/conditions",
            "templated": false
        },
        "configprops": {
            "href": "http://localhost:8080/actuator/configprops",
            "templated": false
        },
        "env": {
            "href": "http://localhost:8080/actuator/env",
            "templated": false
        },
        "env-toMatch": {
            "href": "http://localhost:8080/actuator/env/{toMatch}",
            "templated": true
        },
        "info": {
            "href": "http://localhost:8080/actuator/info",
            "templated": false
        },
        "loggers": {
            "href": "http://localhost:8080/actuator/loggers",
            "templated": false
        },
        "loggers-name": {
            "href": "http://localhost:8080/actuator/loggers/{name}",
            "templated": true
        },
        "heapdump": {
            "href": "http://localhost:8080/actuator/heapdump",
            "templated": false
        },
        "threaddump": {
            "href": "http://localhost:8080/actuator/threaddump",
            "templated": false
        },
        "metrics": {
            "href": "http://localhost:8080/actuator/metrics",
此时项目的详细信息都会展现出来,再看项目健康程度就可以看见更详细的信息
{
    "status": "UP",
    "details": {
        "diskSpace": {
            "status": "UP",
            "details": {
                "total": 154149056512,
                "free": 97539268608,
                "threshold": 10485760
            }
        }
    }
}
常用内置端点解释
| 端点 | 解释 |
|---|---|
| /health | 显示应用程序健康信息 |
| /conditions | 获取自动化配置信息 |
| /beans | 显示程序目前所有bean和相互依赖的关系 |
| /env | 显示系统环境配置信息 |
| /mappings | 查看控制器映射关系 |
| /heapdump | 下载堆dump文件,可以进行内存解析 |
| /metrics | 显示运行时的信息,包括内存,堆栈,线程等 |
| /httptrace | 获取追踪web请求的详细信息 |
| /threaddump | 查看线程应用信息 |
| /loggers | 查看日志详信息 |
可以通过访问以上端点查看所对应的详细信息
是不是觉得json字符串比较难整理,比较难看。所以我们可以引入一款可视化的图形化监控
Actuator图形化监控
创建服务端
- 使用idea快速搭建一个项目
- 保证至少存在这几个依赖
<dependency>
    <groupId>org.springframework.boot</groupId>
    <artifactId>spring-boot-starter-web</artifactId>
</dependency>
<dependency>
    <groupId>de.codecentric</groupId>
    <artifactId>spring-boot-admin-starter-server</artifactId>
</dependency>
- 在启动类上加上@EnableAdminServer注解
package com.dyh;

import de.codecentric.boot.admin.server.config.EnableAdminServer;
import org.springframework.boot.SpringApplication;
import org.springframework.boot.autoconfigure.SpringBootApplication;

@EnableAdminServer
@SpringBootApplication
public class SpringbootServerApplication {

    public static void main(String[] args) {
        SpringApplication.run(SpringbootServerApplication.class, args);
    }

}
创建客户端
- 使用idea快速创建SpringBoot项目
- 保证至少存在这几个依赖
<dependency>
    <groupId>de.codecentric</groupId>
    <artifactId>spring-boot-admin-starter-client</artifactId>
</dependency>
<dependency>
    <groupId>org.springframework.boot</groupId>
    <artifactId>spring-boot-starter-web</artifactId>
</dependency>
- 在配置文件中进行相关配置
server.port=8081
spring.boot.admin.client.url=http://localhost:8080

management.endpoint.health.show-details=always
management.endpoints.web.exposure.include=*
- 启动服务端项目,再启动客户端项目
- 访问http://localhost:8080
访问成功后进入以下界面
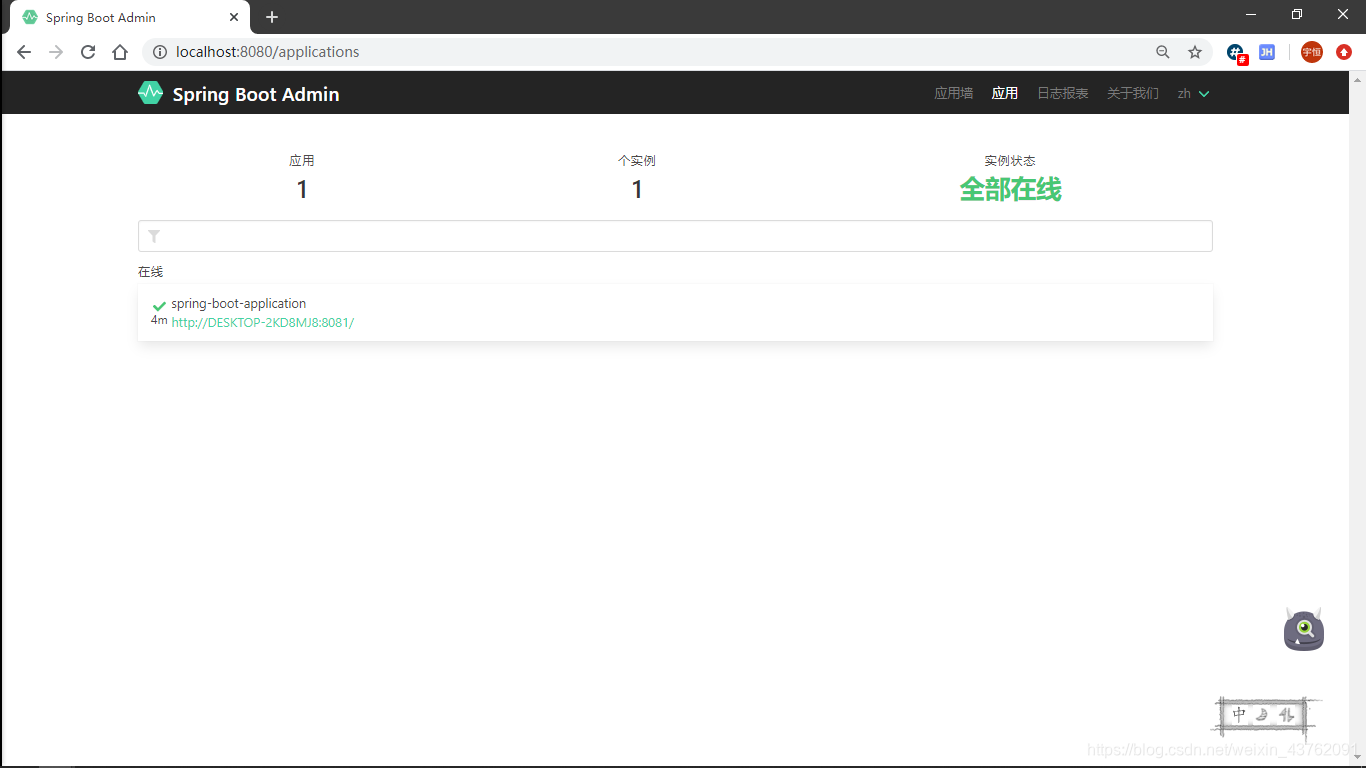
可以看见客户端已经被检测出来,并进行监控
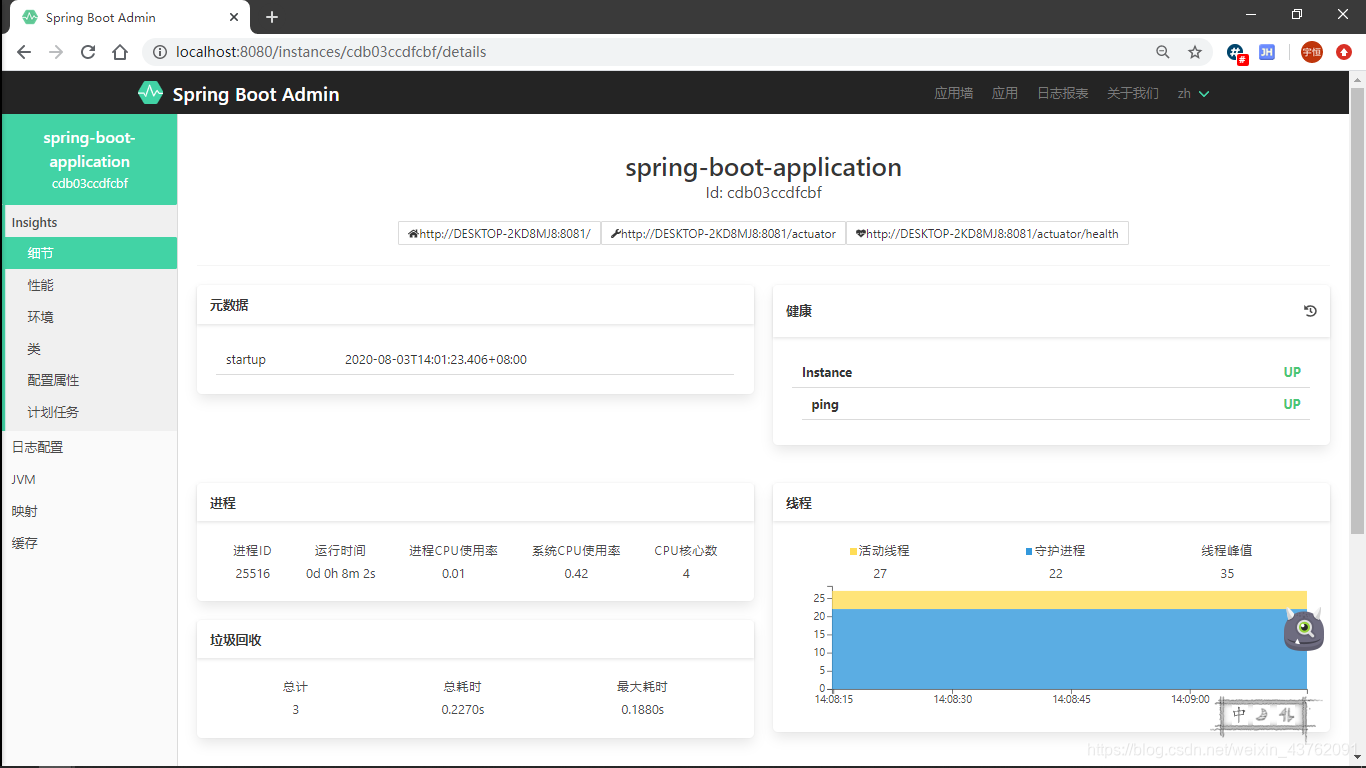
点击客户端进入程序详情
可以观察项目详情、日志、jvm等各种动态详情。


 3万+
3万+

 被折叠的 条评论
为什么被折叠?
被折叠的 条评论
为什么被折叠?
 到【灌水乐园】发言


