


参考:https://www.cnblogs.com/chenhuabin/p/11736088.html
使用显示的过程中需要注意的地方
1,tensorboard --logdir=log  #在终端或命令提示符环境下使用,且log是保存视图文件的文件夹,且不需要加引号
2,为了准确的显示最新的视图内容,最好将旧的删去,否则可能读取旧的视图
3,第1条终端执行不要停止,否则会无法访问网页,
4,一定要确认log文件的位置是否正确,否则会出现有文件,而无法显示出图像的情况
tensorboard的整体网络图的分布
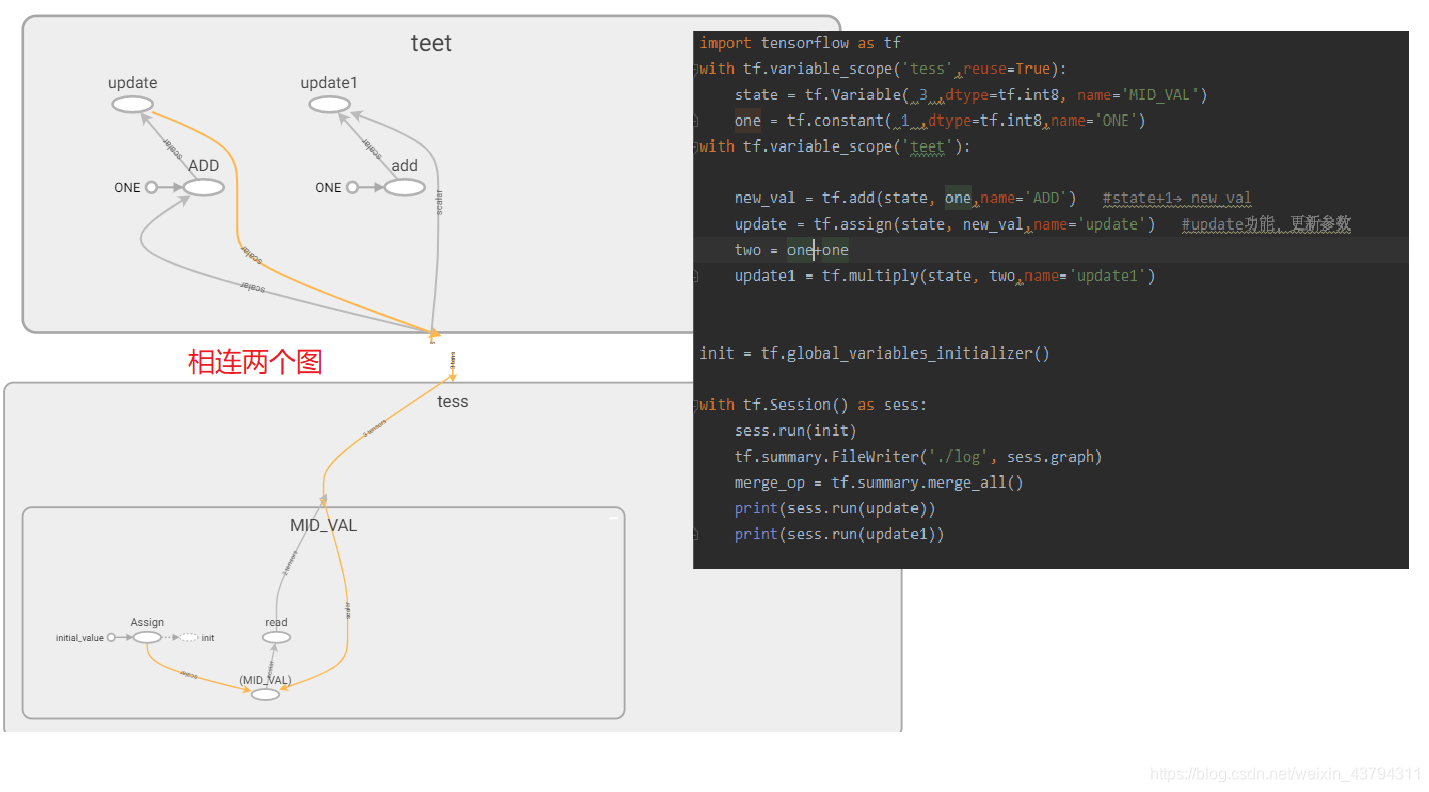
源代码
import tensorflow as tf
with tf.variable_scope('tess',reuse=True):
    state = tf.Variable( 3 ,dtype=tf.int32, name='MID_VAL')
    one = tf.constant( 1 ,dtype=tf.int32,name='ONE')
with tf.variable_scope('teet'):

    new_val = tf.add(state, one,name='ADD')   #state+1→ new_val
    update = tf.assign(state, new_val,name='update')   #update功能,更新参数
    two = one+one   #########################修改这个地方就会出现不同的结果
    update1 = tf.multiply(state, two,name='update1')


init = tf.global_variables_initializer()

with tf.Session() as sess:
    sess.run(init)
    tf.summary.FileWriter('./log', sess.graph)
    merge_op = tf.summary.merge_all()
       #### 单独运行,第一种显示结果
    # print(sess.run(update1))   #两行输出结果 0,1
    # print(sess.run(update))
    ## 单独运行,第二种显示结果
    # print(sess.run(update))   #两行输出结果 1,2
    # print(sess.run(update1))
    ## 单独运行,第3种显示结果
    # print(sess.run([update1,update]))  #两行输出结果 2,1
## 单独运行,第4种显示结果
    print(sess.run([update,update1]))  #两行输出结果 1,2
从上面的几种输出可以看出,sess.run 运行时,只执行和内容相关的步骤,
因此第一和第二种不只是数据颠倒,因为update执行了赋值的步骤
第三和第四则只是将数据改变了位置,其他没什么变化,说明多个数据的同时访问,是输入和输出同时发生的,没有先后顺序
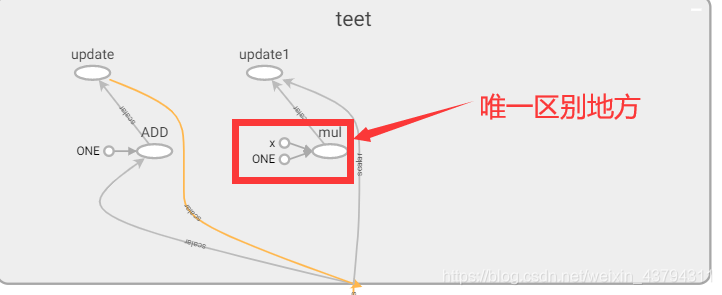
第一种修改
改变一下代码会改变第三和第四的输出,输出变为1,0和0,1,two = one+one →two = 2*one,这表明在update1读取的数据state从1变成了没有经过赋值前的0 。
输入的x就是two = 2*one中的2,mul就是相乘操作,前面的那个只有一个one输入和add的加操作
two = 2*one
#two = tf.multiply(2,one)#同样的效果
第二种修改
不使用two中间参数,直接使用one,第三和第四的结果都是1,1,这时update1的state数据就是update赋值后的1,
update1 = tf.multiply(state, one,name='update1')
通过上面两次代码修改,感觉是同时运行的数据读取更新时间问题,导致数据读取不同
有待证明或专业文档解释,没能理解数据更新和读取关系
1,two = one+one    结果 1,2
2,two = 2*one     结果1,0
3,one             结果1,0
多种tensorboard的函数的意义
参考:https://blog.csdn.net/weixin_41950276/article/details/82918372
1、tf.summary.scalar:用来显示标量信息
例如:tf.summary.scalar(‘mean’, mean)
一般在画loss,accuary时会用到这个函数。
2、tf.summary.histogram:用来显示直方图信息
例如: tf.summary.histogram(‘histogram’, var)
一般用来显示训练过程中变量的分布情况
3、tf.summary.distribution:分布图,一般用于显示weights分布
4、tf.summary.text:可以将文本类型的数据转换为tensor写入summary中
5、tf.summary.image:输出带图像的probuf,汇总数据的图像的的形式如下:
’ tag /image/0’, ’ tag /image/1’…,如:input/image/0等。
格式:tf.summary.image(tag, tensor, max_images=3, collections=None, name=Non
6、tf.summary.audio:展示训练过程中记录的音频
7、tf.summary.merge_all:merge_all 可以将所有summary全部保存到磁盘,以便tensorboard显示。如果没有特殊要求,一般用这一句就可一显示训练时的各种信息了。
格式:tf.summaries.merge_all(key=‘summaries’)
8、tf.summary.FileWriter:指定一个文件用来保存图。
格式:tf.summary.FileWritter(path,sess.graph)
可以调用其add_summary()方法将训练过程数据保存在filewriter指定的文件中
9.tensorboard --logdir=/summary_dir :开启tensorboard,注意/summary_dir不用加引号
可视化图像的源代码
参考:https://morvanzhou.github.io/tutorials/
"""
Know more, visit my Python tutorial page: https://morvanzhou.github.io/tutorials/
My Youtube Channel: https://www.youtube.com/user/MorvanZhou

Dependencies:
tensorflow: 1.1.0
numpy
"""
import tensorflow as tf
import numpy as np

tf.set_random_seed(1)
np.random.seed(1)

# fake data
x = np.linspace(-1, 1, 10)[:, np.newaxis]          # shape (100, 1),修改后
noise = np.random.normal(0, 0.1, size=x.shape)
y = np.power(x, 2) + noise                          # shape (100, 1) + some noise

with tf.name_scope('Inputs'):
    tf_x = tf.placeholder(tf.float32, x.shape, name='x')
    tf_y = tf.placeholder(tf.float32, y.shape, name='y')

with tf.name_scope('Net'):
    l1 = tf.layers.dense(tf_x, 10, tf.nn.relu, name='hidden_layer')
    output = tf.layers.dense(l1, 1, name='output_layer')

    # add to histogram summary
    tf.summary.histogram('h_out', l1)
    tf.summary.histogram('pred', output)

loss = tf.losses.mean_squared_error(tf_y, output, scope='loss')
train_op = tf.train.GradientDescentOptimizer(learning_rate=0.5).minimize(loss)
tf.summary.scalar('loss', loss)     # add loss to scalar summary

sess = tf.Session()
sess.run(tf.global_variables_initializer())

writer = tf.summary.FileWriter('./log', sess.graph)     # write to file
merge_op = tf.summary.merge_all()                       # operation to merge all summary

for step in range(100):    ## 改变数据后图像数组数减少
    # train and net output
    _, result = sess.run([train_op, merge_op], {tf_x: x, tf_y: y})
    writer.add_summary(result, step)

# Lastly, in your terminal or CMD, type this :
# $ tensorboard --logdir path/to/log
# open you google chrome, type the link shown on your terminal or CMD. (something like this: http://localhost:6006)
图像的比较
参考:https://www.cnblogs.com/chouxianyu/p/12622914.html
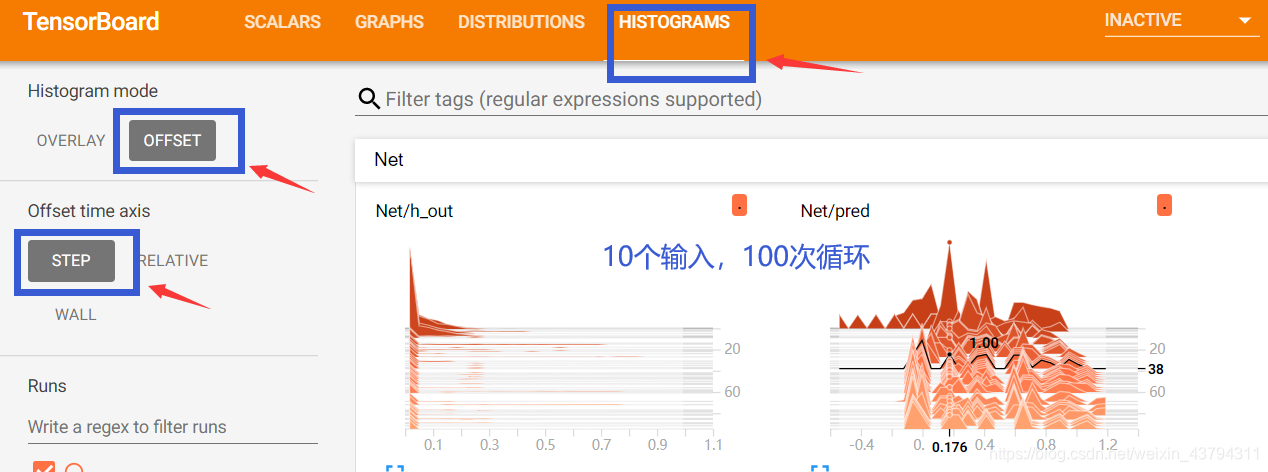
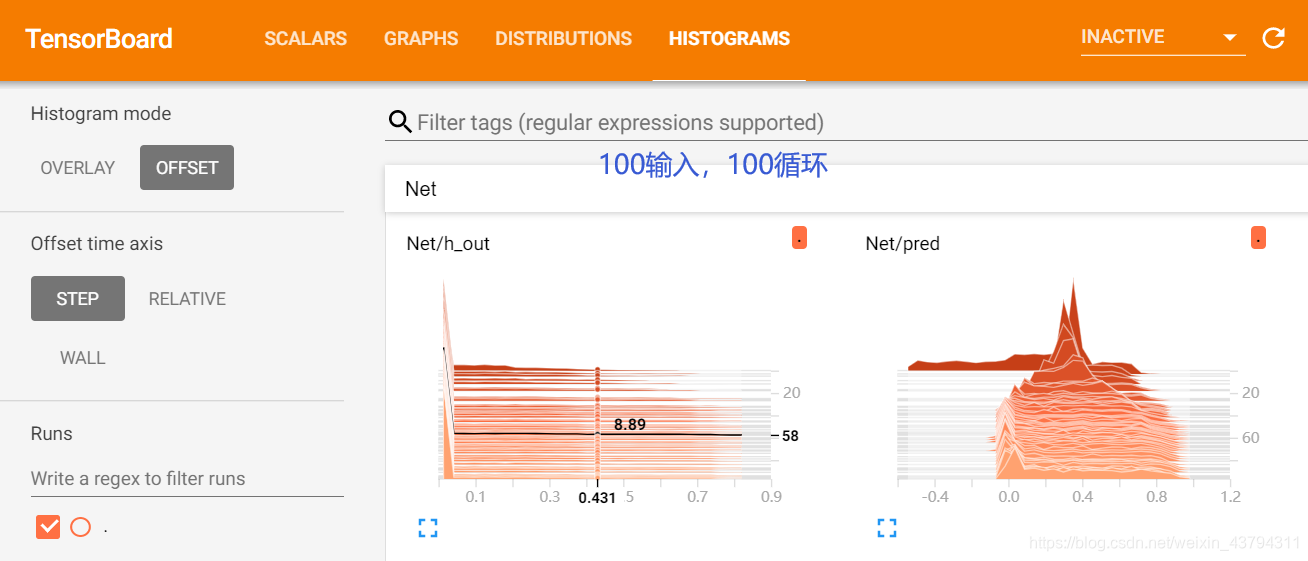
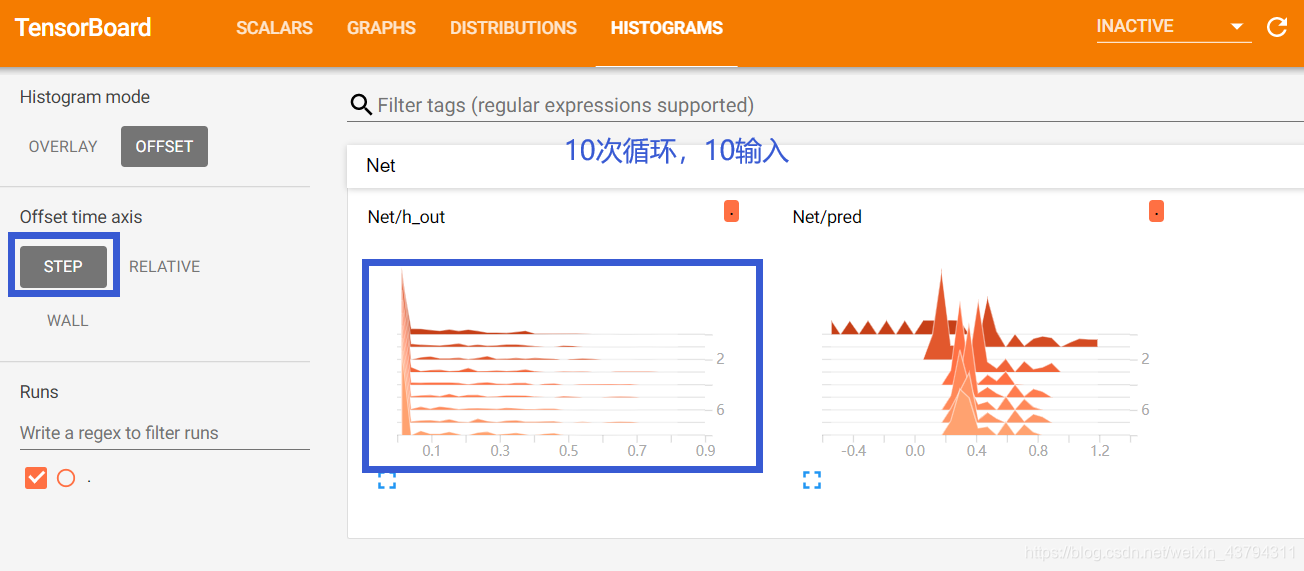
输入数据量和循环执行次数
从下面的图像可以看出,线的条数和循环次数有关,
右边的值不是值的大小,而是结果每一组数据结果的次序,从上向下,从0开始递减值,
这里的值可以认为是神经网络中的参数值的分布情况,调整seed出现变化,颜色最深的图
数据时间变化,颜色由深到浅
需要改代码中的数据个数,和循环次数
修改网络的随机参数为199
tf.set_random_seed(199)
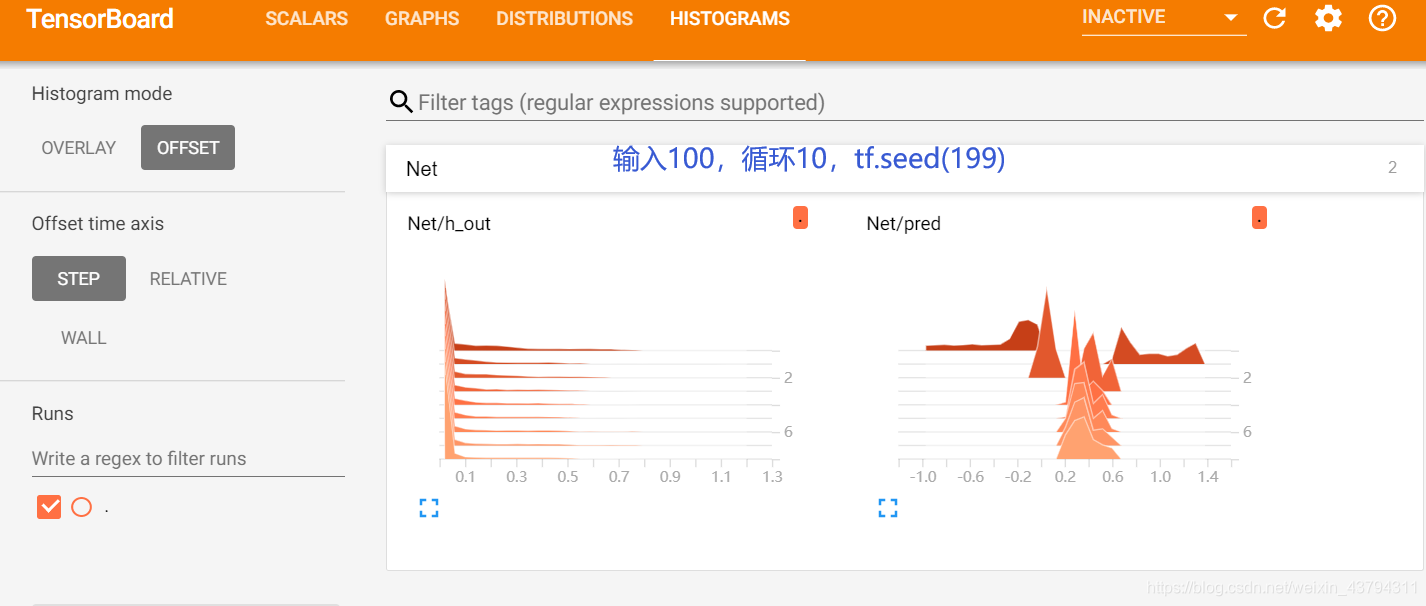
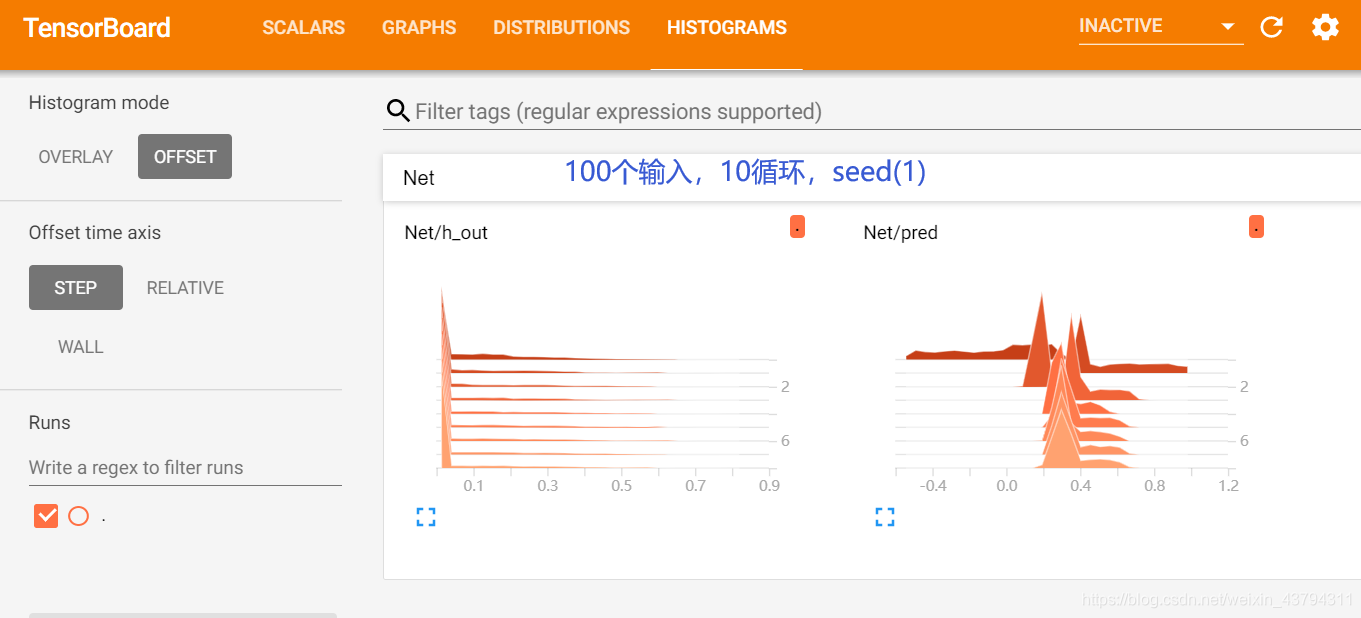
循环次数和输入次数改变
x = np.linspace(-1, 1, 10)[:, np.newaxis]
for step in range(100):
hist图像的细节显示
这里选择边界的74,是因为绘制直方图的中间点可能是小范围之间取值的连接线,导致取值不是整数
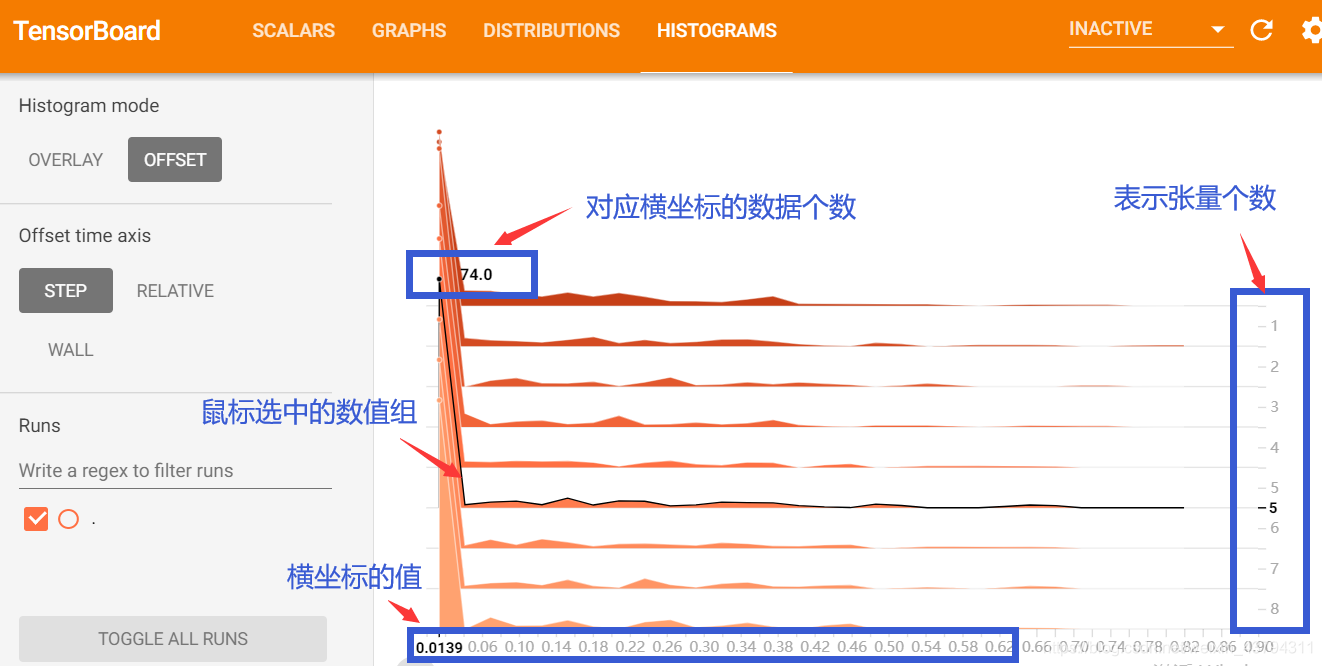
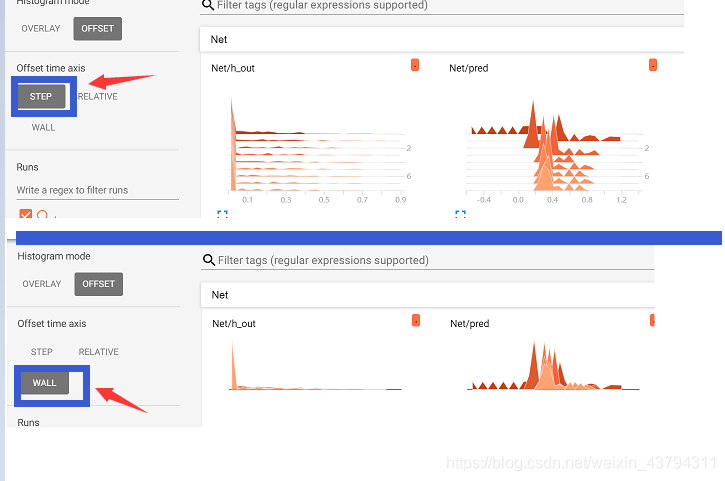
同种数据的不同显示形式,两种是把纵坐标偏移了


 6万+
6万+

 被折叠的 条评论
为什么被折叠?
被折叠的 条评论
为什么被折叠?
 到【灌水乐园】发言


