


DecisionTreeClassifier实例
DecisionTreeClassifier使用
- DecisionTreeClassifier对数据集执行多分类预测的模型
from sklearn import tree
#构造训练数据和标签
X=[[0,0],[1,1]]
Y=[0,1]
#实例化分类决策树模型
clf = tree.DecisionTreeClassifier()
#模型训练
clf = clf.fit(X,Y)
#模型预测
pred=clf.predict([[2,2]])#预测类别
print("pred:{}".format(pred))
prob=clf.predict_proba([[2,2]])
print('prob:{}'.format(prob))
pred:[1]
prob:[[0. 1.]]
example
from sklearn.datasets import load_iris
from sklearn import tree
#数据加载
iris = load_iris()
X,y=iris.data,iris.target
print("X shape:{}, Y shape:{}".format(X.shape,y.shape))
X shape:(150, 4), Y shape:(150,)
# 模型训练
clf = tree.DecisionTreeClassifier()
clf = clf.fit(X,y)
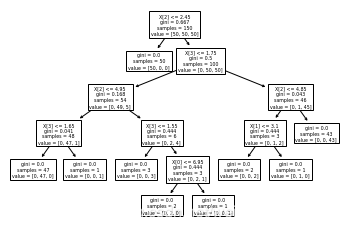
#绘制决策树
tree.plot_tree(clf)
[Text(167.4, 199.32, 'X[2] <= 2.45\ngini = 0.667\nsamples = 150\nvalue = [50, 50, 50]'),
 Text(141.64615384615385, 163.07999999999998, 'gini = 0.0\nsamples = 50\nvalue = [50, 0, 0]'),
 Text(193.15384615384616, 163.07999999999998, 'X[3] <= 1.75\ngini = 0.5\nsamples = 100\nvalue = [0, 50, 50]'),
 Text(103.01538461538462, 126.83999999999999, 'X[2] <= 4.95\ngini = 0.168\nsamples = 54\nvalue = [0, 49, 5]'),
 Text(51.50769230769231, 90.6, 'X[3] <= 1.65\ngini = 0.041\nsamples = 48\nvalue = [0, 47, 1]'),
 Text(25.753846153846155, 54.359999999999985, 'gini = 0.0\nsamples = 47\nvalue = [0, 47, 0]'),
 Text(77.26153846153846, 54.359999999999985, 'gini = 0.0\nsamples = 1\nvalue = [0, 0, 1]'),
 Text(154.52307692307693, 90.6, 'X[3] <= 1.55\ngini = 0.444\nsamples = 6\nvalue = [0, 2, 4]'),
 Text(128.76923076923077, 54.359999999999985, 'gini = 0.0\nsamples = 3\nvalue = [0, 0, 3]'),
 Text(180.27692307692308, 54.359999999999985, 'X[0] <= 6.95\ngini = 0.444\nsamples = 3\nvalue = [0, 2, 1]'),
 Text(154.52307692307693, 18.119999999999976, 'gini = 0.0\nsamples = 2\nvalue = [0, 2, 0]'),
 Text(206.03076923076924, 18.119999999999976, 'gini = 0.0\nsamples = 1\nvalue = [0, 0, 1]'),
 Text(283.2923076923077, 126.83999999999999, 'X[2] <= 4.85\ngini = 0.043\nsamples = 46\nvalue = [0, 1, 45]'),
 Text(257.53846153846155, 90.6, 'X[1] <= 3.1\ngini = 0.444\nsamples = 3\nvalue = [0, 1, 2]'),
 Text(231.7846153846154, 54.359999999999985, 'gini = 0.0\nsamples = 2\nvalue = [0, 0, 2]'),
 Text(283.2923076923077, 54.359999999999985, 'gini = 0.0\nsamples = 1\nvalue = [0, 1, 0]'),
 Text(309.04615384615386, 90.6, 'gini = 0.0\nsamples = 43\nvalue = [0, 0, 43]')]
#Graphviz导出决策树
import graphviz
dot_data = tree.export_graphviz(clf,out_file=None,
                               feature_names=iris.feature_names,
                               class_names=iris.target_names,
                               filled=True,rounded=True,
                               special_characters=True)
graph=graphviz.Source(dot_data)
graph
[外链图片转存失败,源站可能有防盗链机制,建议将图片保存下来直接上传(img-Q28ItnUw-1627566904981)(output_12_0.svg)]
回归决策树
#加载库
import numpy as np
from sklearn.tree import DecisionTreeRegressor
import matplotlib.pyplot as plt
#创建随机数据集
rng = np.random.RandomState(1)
X=np.sort(5*rng.rand(80,1),axis=0)
y=np.sin(X).ravel()#ravel将多维数组变成一维
y[::5]+=3*(0.5-rng.rand(16))#添加扰动
#模型训练
regr_1 = DecisionTreeRegressor(max_depth=2)
regr_2 = DecisionTreeRegressor(max_depth=5)
regr_1.fit(X,y)
regr_2.fit(X,y)
DecisionTreeRegressor(max_depth=5)
#预测
X_test = np.arange(0.0,5.0,0.01)[:,np.newaxis]
y_1=regr_1.predict(X_test)
y_2=regr_2.predict(X_test)
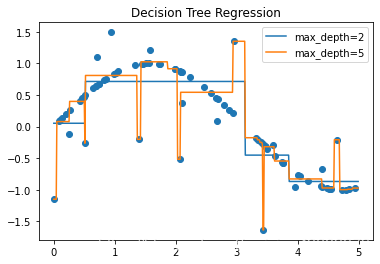
# 结果可视化
plt.figure()
plt.scatter(X,y)
plt.plot(X_test,y_1,label='max_depth=2')
plt.plot(X_test,y_2,label='max_depth=5')
plt.title('Decision Tree Regression')
plt.legend()
plt.show()
参考来源
- https://scikit-learn.org/stable/modules/tree.html?highlight=cart
- https://scikit-learn.org/stable/auto_examples/tree/plot_tree_regression.html#sphx-glr-auto-examples-tree-plot-tree-regression-py


 529
529


 被折叠的 条评论
为什么被折叠?
被折叠的 条评论
为什么被折叠?
 到【灌水乐园】发言


