


 本文介绍了使用matplotlib绘制三维图像的方法,并通过实例展示了如何利用Axes3D对象进行三维图像的绘制。此外,还深入探讨了plt.axes()函数的用法,包括如何在主图上创建子图以及自定义子图的样式。
文章目录
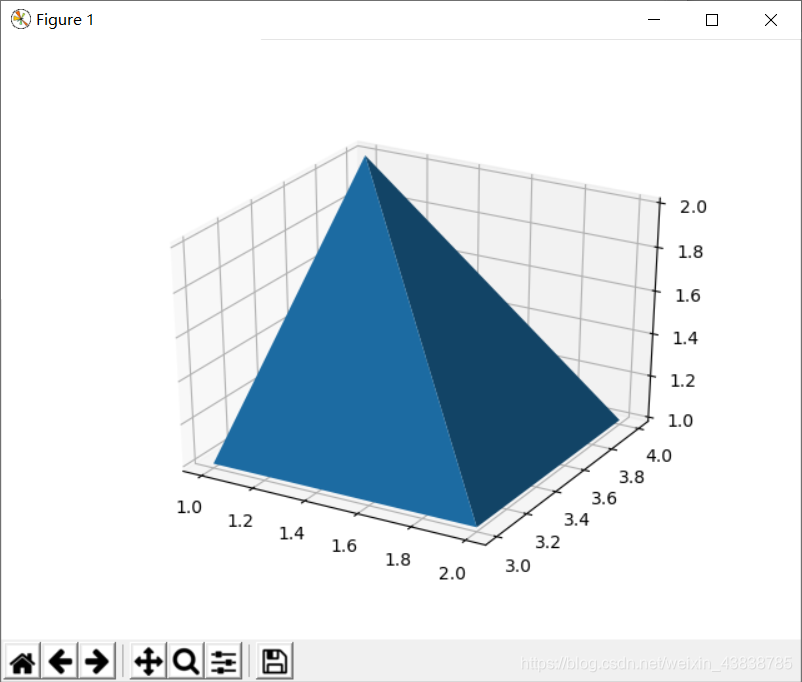
1.绘制三维图像
import matplotlib.pyplot as plt
from mpl_toolkits.mplot3d import Axes3D
fig = plt.figure()
ax = fig.add_subplot(111, projection='3d')
X = [1, 1, 2, 2]
Y = [3, 4, 4, 3]
Z = [1, 2, 1, 1]
ax.plot_trisurf(X, Y, Z)
plt.show()
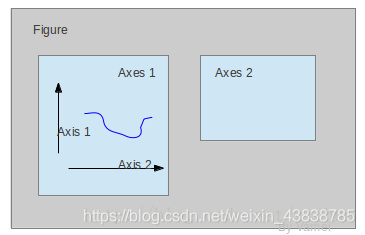
2.plt.axes()
我们先来看什么是Figure和Axes对象。在matplotlib中,整个图像为一个Figure对象。在Figure对象中可以包含一个,或者多个Axes对象。每个Axes对象都是一个拥有自己坐标系统的绘图区域。其逻辑关系如下:
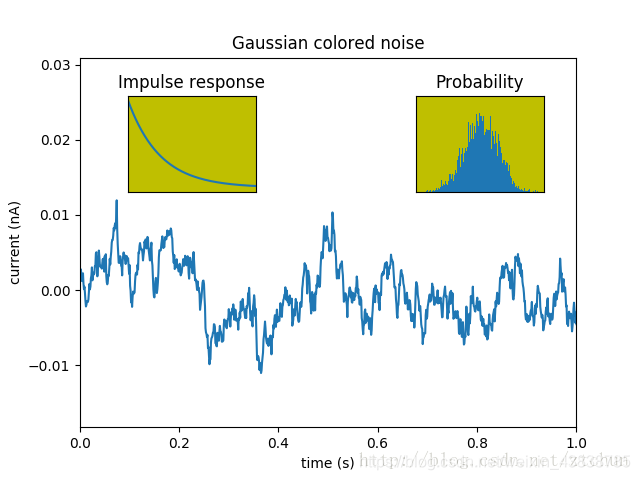
import matplotlib.pyplot as plt
import numpy as np

# create some data to use for the plot
dt = 0.001
t = np.arange(0.0, 10.0, dt)
r = np.exp(-t[:1000] / 0.05)  # impulse response
x = np.random.randn(len(t))
s = np.convolve(x, r)[:len(x)] * dt  # colored noise

# the main axes is subplot(111) by default
plt.plot(t, s)
plt.axis([0, 1, 1.1 * np.amin(s), 2 * np.amax(s)])
plt.xlabel('time (s)')
plt.ylabel('current (nA)')
plt.title('Gaussian colored noise')

# this is an inset axes over the main axes
a = plt.axes([.65, .6, .2, .2], axisbg='y')
n, bins, patches = plt.hist(s, 400, normed=1)
plt.title('Probability')
plt.xticks([])
plt.yticks([])

# this is another inset axes over the main axes
a = plt.axes([0.2, 0.6, .2, .2], axisbg='y')
plt.plot(t[:len(r)], r)
plt.title('Impulse response')
plt.xlim(0, 0.2)
plt.xticks([])
plt.yticks([])

plt.show()


 1372
1372

 被折叠的 条评论
为什么被折叠?
被折叠的 条评论
为什么被折叠?
 到【灌水乐园】发言


