


前言
论文实验部分通常需要画各种图,可视化使效果更直观,本文总结和整理几种论文中常见的图的python实现方法。
图(一)
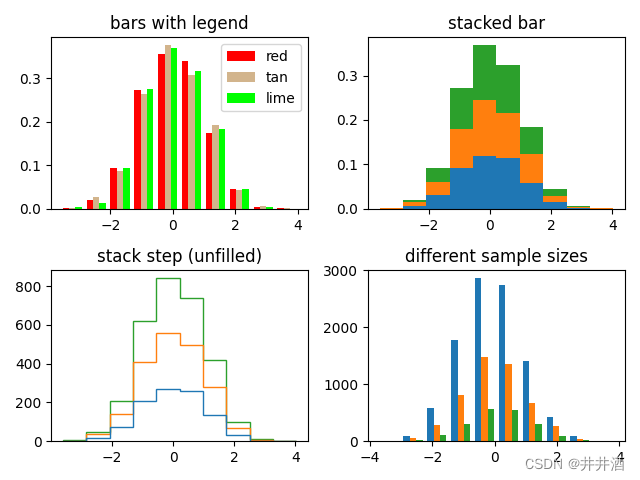
实现代码
import numpy as np
import matplotlib.pyplot as plt

np.random.seed(19680801)

n_bins = 10
x = np.random.randn(1000, 3)

fig, axes = plt.subplots(nrows=2, ncols=2)
ax0, ax1, ax2, ax3 = axes.flatten()

colors = ['red', 'tan', 'lime']
ax0.hist(x, n_bins, density=True, histtype='bar', color=colors, label=colors)
ax0.legend(prop={'size': 10})
ax0.set_title('bars with legend')

ax1.hist(x, n_bins, density=True, histtype='bar', stacked=True)
ax1.set_title('stacked bar')

ax2.hist(x, n_bins, histtype='step', stacked=True, fill=False)
ax2.set_title('stack step (unfilled)')

# Make a multiple-histogram of data-sets with different length.
x_multi = [np.random.randn(n) for n in [10000, 5000, 2000]]
ax3.hist(x_multi, n_bins, histtype='bar')
ax3.set_title('different sample sizes')

fig.tight_layout()
plt.show()
图(二)
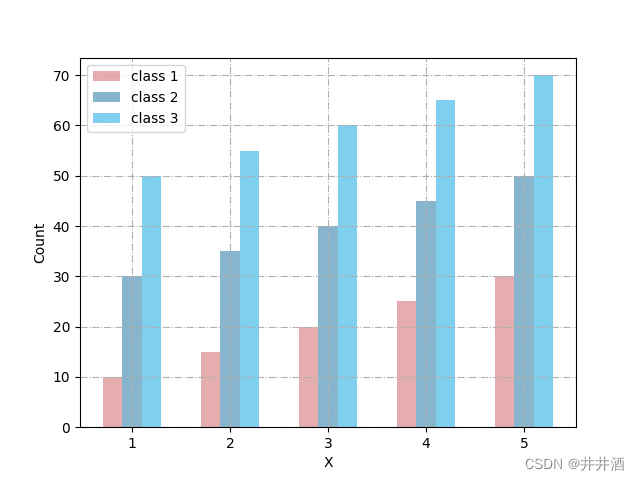
实现代码
import numpy as np
import matplotlib.pyplot as plt
# # // 设置中文字体
# font_set = FontProperties(fname=r"***path***/mpl-data/fonts/simfang.ttf")
# # // 设置生成图片的分辨率
# matplotlib.rcParams['figure.figsize']
# matplotlib.rcParams['savefig.dpi']
# plt.rcParams['font.sas-serig']=['simfang']
# plt.rcParams['axes.unicode_minus']=False

n_groups = 5
class1 = (10, 15,20, 25, 30)
class2 = (30, 35, 40, 45, 50)
class3 = (50, 55, 60,65, 70)

fig, ax = plt.subplots()
index = np.arange(n_groups)
bar_width = 0.2
opacity = 0.5
error_config = {'ecolor': '0.3'}
rects1 = ax.bar(index, class1, bar_width,
                alpha=opacity, color='indianred',
                error_kw=error_config,
                label='class 1')
rects2 = ax.bar(index + bar_width, class2, bar_width,
                alpha=opacity, color='#106D9C',
                error_kw=error_config,
                label='class 2')
rects3 = ax.bar(index + bar_width + bar_width, class3, bar_width,
                alpha=opacity, color='#00A2DE',
                error_kw=error_config,
                label='class 3')

ax.set_xticks(index + 3 * bar_width / 3)
ax.set_xticklabels(('1', '2', '3', '4', '5'))
ax.legend()
plt.xlabel(u"X")
plt.ylabel(u'Count')
fig.tight_layout()
# plt.savefig('result.png', dpi=200)
plt.grid(ls='-.')  # 绘制背景线
plt.show()
图(三)
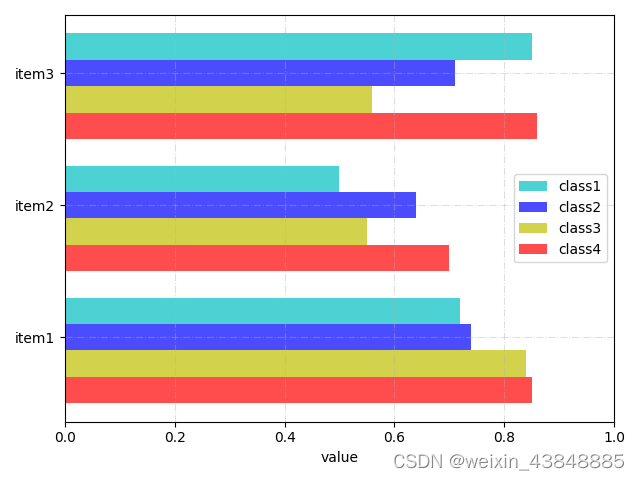
实现代码
from matplotlib import pyplot as plt

a = ["item1","item2", "item3"]
b_1 = [0.72, 0.5, 0.85]
b_2 = [0.74, 0.64, 0.71]
b_3 = [0.84, 0.55, 0.56]
b_4 = [0.85, 0.7, 0.86]

height = 0.2
a1 = list(range(len(a)))
a2 = [i-height for i in a1]#坐标轴偏移
a3 = [i-height*2 for i in a1]
a4 = [i-height*3 for i in a1]

plt.barh(range(len(a)),b_1,height= height,label = "class1",color = "c", alpha=0.7)
plt.barh(a2,b_2, height= height, label = "class2", color = "b", alpha=0.7)
plt.barh(a3,b_3,height= height,label = "class3",color = "y", alpha=0.7)
plt.barh(a4,b_4,height= height,label = "class4",color = "r", alpha=0.7)

#绘制网格
plt.grid(alpha = 0.4,ls='-.')
#y轴坐标刻度标识
plt.yticks(a2,a)
#添加图例
plt.legend()
#添加横纵坐标,标题
plt.xlabel("value")
# plt.ylabel("name")
# plt.title("title")
plt.xlim(xmax = 1.0)
plt.tight_layout()
plt.show()
图(四)
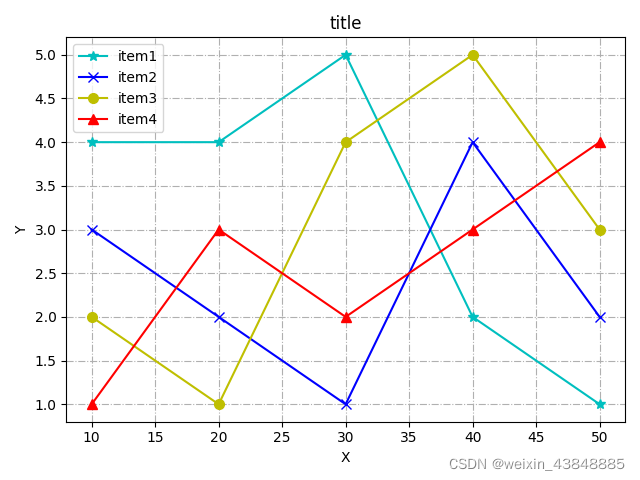
实现代码
import matplotlib.pyplot as plt
import numpy as np

x = [10, 20, 30, 40, 50]
y1 = [4, 4, 5, 2, 1]
y2 = [3, 2, 1, 4, 2]
y3 = [2, 1, 4, 5, 3]
y4 = [1, 3, 2, 3, 4]
#绘制折线图,添加数据点,设置点的大小
# 此处也可以不设置线条颜色,matplotlib会自动为线条添加不同的颜色
plt.plot(x, y1, alpha=1, color="c", marker='*', markersize=7)
plt.plot(x, y2, alpha=1, color='b', marker='x',markersize=7)
plt.plot(x, y3, alpha=1, color='y', marker='o',markersize=7)
plt.plot(x, y4, alpha=1, color='r', marker='^',markersize=7)
# plt.yticks(np.arange(0.5, 3.25, step=0.25))
# plt.ylim(ymin=-0.005)
# plt.xticks(np.arange(8, 70, step=8))
plt.title('title')  # 折线图标题
plt.xlabel('X')  # x轴标题
plt.ylabel('Y')  # y轴标题
plt.grid(ls='-.')  # 绘制背景线
plt.legend(['item1', 'item2', 'item3', 'item4'])
plt.tight_layout()
plt.show()


 3万+
3万+


 被折叠的 条评论
为什么被折叠?
被折叠的 条评论
为什么被折叠?
 到【灌水乐园】发言


