


安装依赖
    "xlsx": "^0.18.5",
    "xlsx-style": "^0.8.13"
    "file-saver": "^2.0.5",
工具类
toolUtil
const autoHeight = () => {
    let winHeight = 0
    if (window.innerHeight) {
        winHeight = window.innerHeight
    } else if (document.body && document.body.clientHeight) {
        winHeight = document.body.clientHeight
    }
    if (document.documentElement && document.documentElement.clientHeight) {
        winHeight = document.documentElement.clientHeight
    }
    return winHeight
}

const toParams = (params) => {
    let par = "";
    for (let p in params) {
        if (params[p] != null && params[p] != "") {
            par += '&' + p + '=' + encodeURIComponent(params[p])
        }
    }
    if (par.length > 0) {
        par = par.substring(1, par.length)
    }
    return par
}

const formatTime = (date = new Date(), fmt = 'yyyy-MM-dd hh:mm:ss') => {
    if (typeof date === 'string') {
        date = date.replace(/-/g, '/')
    }
    date = new Date(date)
    const o = {
        'M+': date.getMonth() + 1, // 月份
        'd+': date.getDate(), // 日
        'h+': date.getHours(), // 小时
        'm+': date.getMinutes(), // 分
        's+': date.getSeconds(), // 秒
        'q+': Math.floor((date.getMonth() + 3) / 3), // 季度
        'S+': date.getMilliseconds(), // 毫秒
        w: date.getDay() // 周
    }
    if ((/(y+)/).test(fmt)) {
        fmt = fmt.replace(RegExp.$1, `${date.getFullYear()}`.substr(4 - RegExp.$1.length))
    }
    for (const k in o) {
        if (new RegExp(`(${k})`).test(fmt)) {
            fmt = fmt.replace(RegExp.$1, RegExp.$1.length == 1 ? o[k] : `00${o[k]}`.substr(`${o[k]}`.length))
        }
    }
    return fmt
}

const exportChartAsImage = (chartInstance, imageName) => {
    const type = 'png';
    const imgData = chartInstance.getDataURL({
        type: type,
        pixelRatio: 2,
        backgroundColor: '#fff'
    });

    const img = new Image();
    img.src = imgData;
    img.crossOrigin = 'Anonymous';
    img.onload = function () {
        const canvas = document.createElement('canvas');
        canvas.width = img.width;
        canvas.height = img.height;
        const ctx = canvas.getContext('2d');
        ctx.drawImage(img, 0, 0);
        const a = document.createElement('a');
        a.href = canvas.toDataURL('image/png');
        a.download = imageName || 'chart';
        a.click();
    };
}

const generateRandomColor=()=> {
    const r = Math.floor(Math.random() * 256).toString(16); // 生成一个0至255之间的随机数并转换为16进制
    const g = Math.floor(Math.random() * 256).toString(16);
    const b = Math.floor(Math.random() * 256).toString(16);

    // 如果生成的16进制数不是两位的,补0
    return `#${r.padStart(2, '0')}${g.padStart(2, '0')}${b.padStart(2, '0')}`;
  }

export default {
    autoHeight,
    toParams,
    formatTime,
    exportChartAsImage,
    generateRandomColor
}
xlsxUtil
import * as XLSX from 'xlsx'
import XLSXStyle from 'xlsx-style'
import FileSaver from 'file-saver'

const setExlStyle = (data) => {
  // 单元格外侧框线
  let borderAll = {
    top: {
      style: 'thin'
    },
    bottom: {
      style: 'thin'
    },
    left: {
      style: 'thin'
    },
    right: {
      style: 'thin'
    }
  }
  data['!cols'] = []
  for (let key in data) {
    if (data[key] instanceof Object) {
      data[key].s = {
        border: borderAll,
        alignment: {
          horizontal: 'center',
          vertical: 'center'
        },
        font: {
          sz: 11
        },
        bold: true,
        numFmt: 0
      }
      data['!cols'].push({
        wpx: 70
      })
    }
  }
  return data
}

const addRangeBorder = (range, ws) => {
  let cols = ['A', 'B', 'C', 'D', 'E', 'F', 'G', 'H', 'I', 'J', 'K', 'L', 'M', 'N', 'O', 'P', 'Q', 'R', 'S', 'T', 'U', 'V', 'W', 'X', 'Y', 'Z']
  range.forEach(item => {
    let style = {
      s: {
        border: {
          top: { style: 'thin' },
          left: { style: 'thin' },
          bottom: { style: 'thin' },
          right: { style: 'thin' }
        }
      }
    }
    // 处理合并行
    for (let i = item.s.c; i <= item.e.c; i++) {
      ws[`${cols[i]}${Number(item.e.r) + 1}`] = ws[`${cols[i]}${Number(item.e.r) + 1}`] || style
      // 处理合并列
      for (let k = item.s.r + 2; k <= item.e.r + 1; k++) {
        ws[cols[i] + k] = ws[cols[k] + item.e.r] || style
      }
    }
  })
  return ws
}

const exportXlsx = (id, fileName = '文件', isMerge = false) => {
  if (id == null) {
    return
  }
  let ws = XLSX.utils.table_to_sheet(document.querySelector(id), { raw: true })
  let wb = XLSX.utils.book_new()
  XLSX.utils.book_append_sheet(wb, ws, 'Sheet1')
  setExlStyle(wb['Sheets']['Sheet1'])
  if (isMerge) {
    addRangeBorder(wb['Sheets']['Sheet1']['!merges'], wb['Sheets']['Sheet1'])
  }
  let wbout = XLSXStyle.write(wb, {
    // bookType: 'xlsx',
    // bookSST: true,
    // type: 'array'
    type: 'buffer'
  })
  try {
    FileSaver.saveAs(new Blob([wbout], {
      type: 'application/octet-stream',
    }), fileName + '.xlsx')
  } catch (e) {
    if (typeof console !== 'undefined') console.log(e, wbout)
  }
  return wbout
}

export default {
  exportXlsx,
  setExlStyle,
  addRangeBorder
}
使用方式
import toolUtil from "@/utils/toolUtil";
import xlsxUtil from "@/utils/xlsxUtil";


 exportExcel() {
 		// 初始化后额eChart实例对象
      let myChart = this.$refs.LineChartRef.chart;
      toolUtil.exportChartAsImage(
        myChart,
        `年度视力统计`
      );
      // #idTable 位table的id
      xlsxUtil.exportXlsx(
        "#idTable",
        `年度视力统计`,
        true
      );
    },
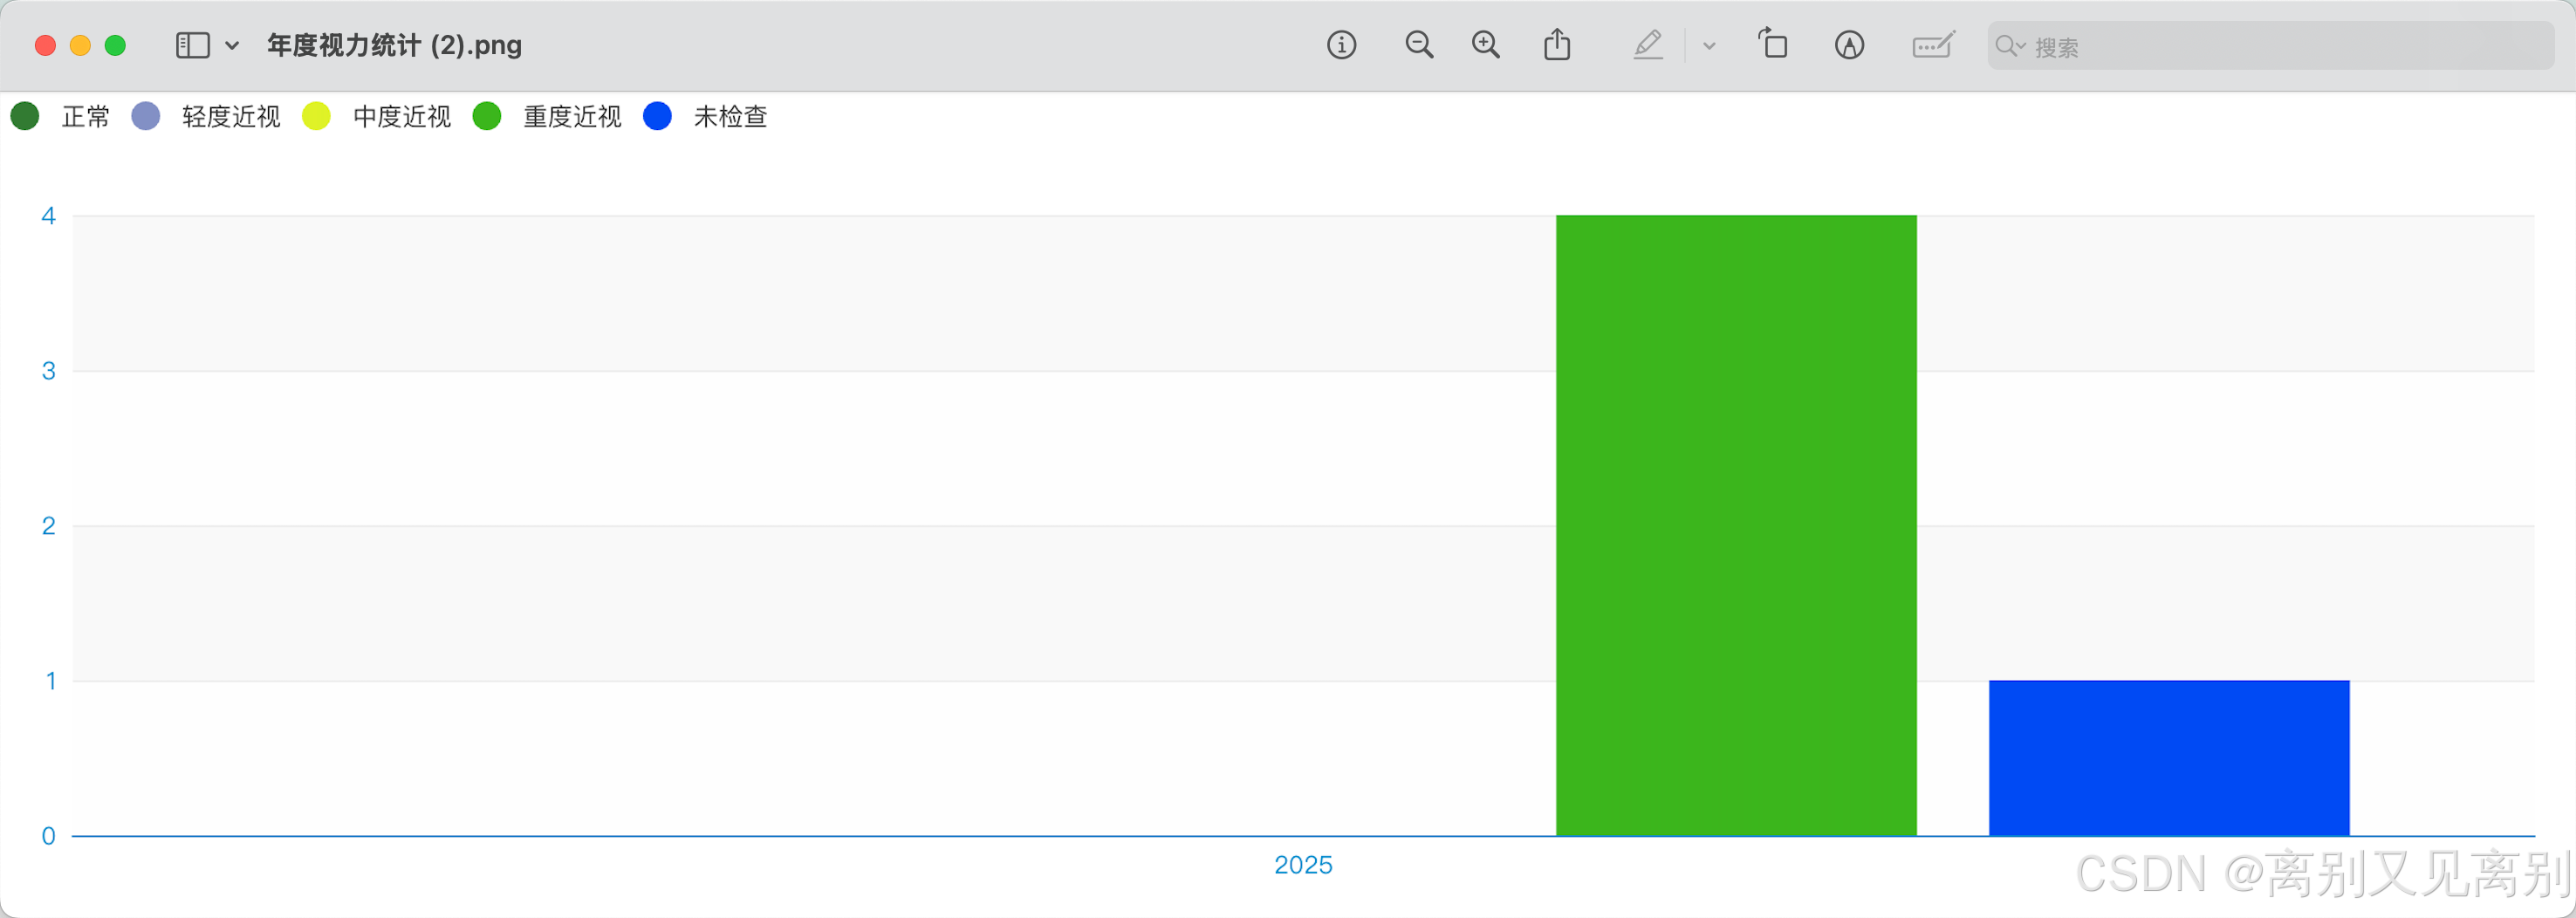
效果
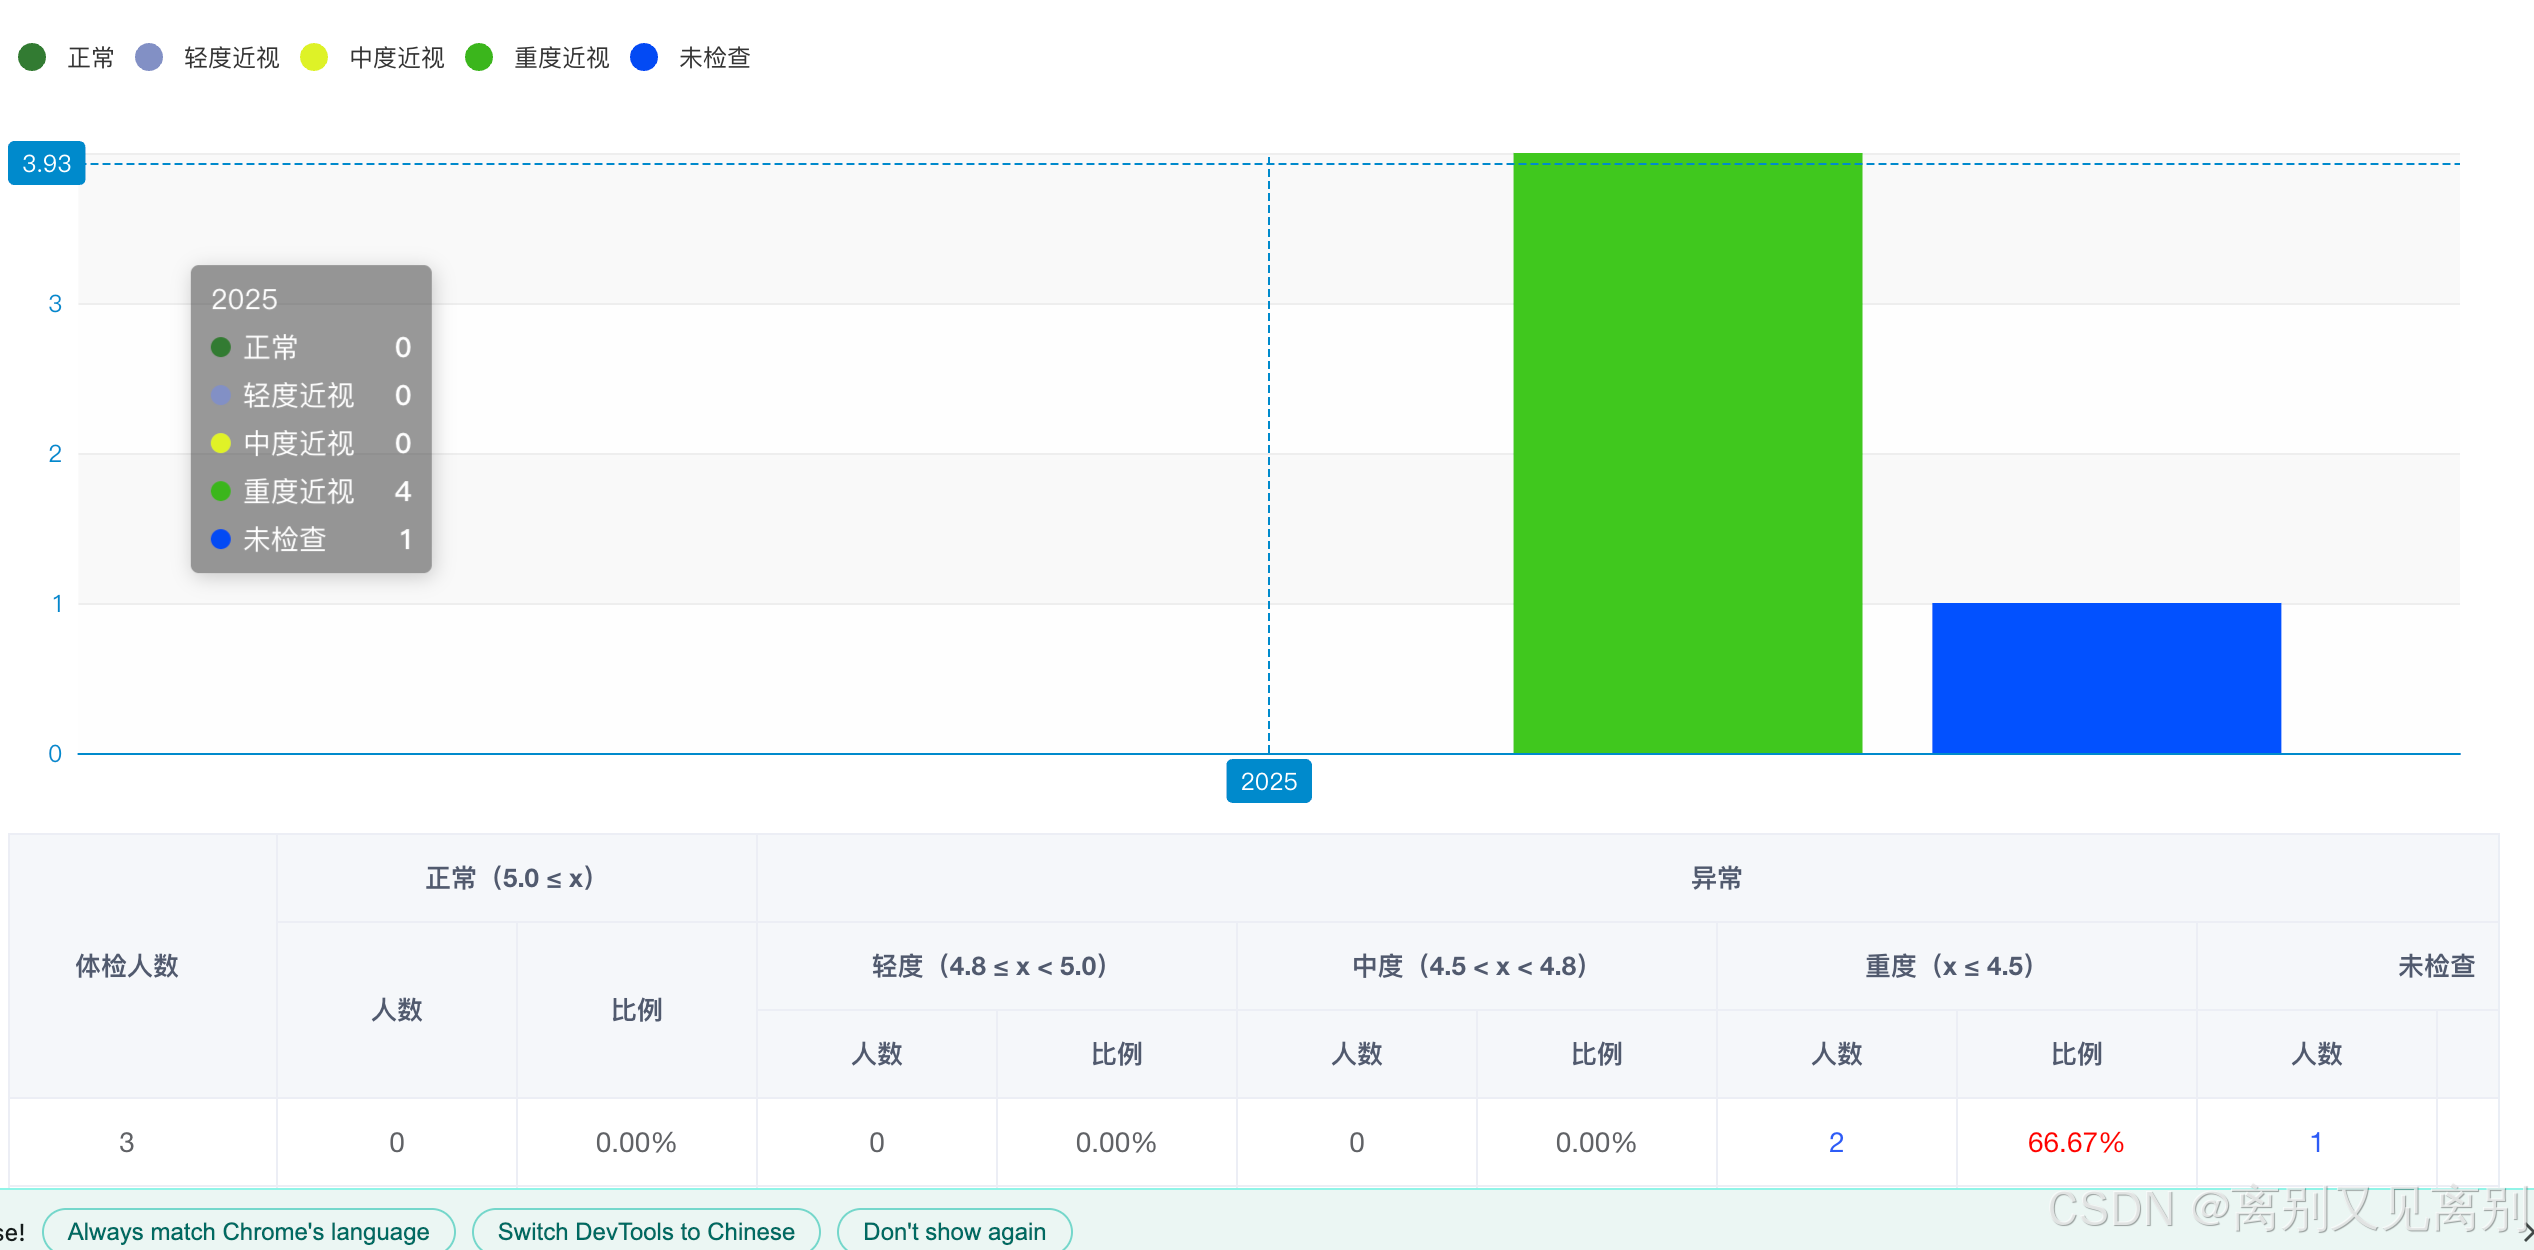

echarts 图片
table表格


 4349
4349

 被折叠的 条评论
为什么被折叠?
被折叠的 条评论
为什么被折叠?
 到【灌水乐园】发言


