


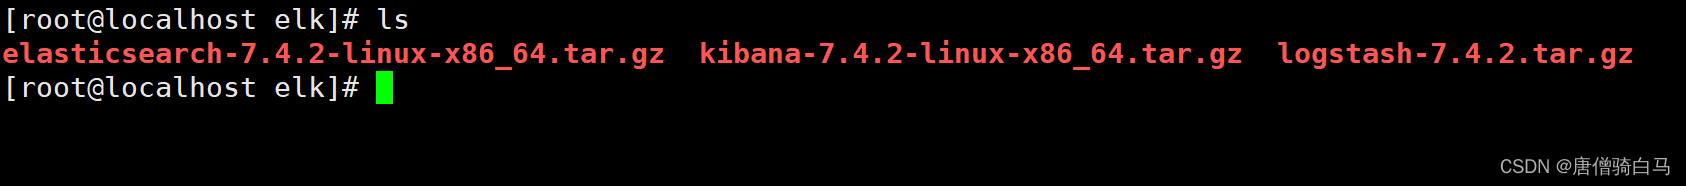
1、下载安装包
使用华为镜像站下载速度很快,华为镜像站:https://mirrors.huaweicloud.com/home,下载时需要保证版本一致
2、安装elasticsearch
解压到当前目录
[root@localhost elk]# tar zxvf elasticsearch-7.4.2-linux-x86_64.tar.gz
安装,将Elasticsearch移动到/opt目录之中
[root@localhost elk]# mv elasticsearch-7.4.2 /opt
创建Elasticsearch用户
es 规定 root 用户不能启动 es,所以需要新建一个其他用户来启动 es修改配置文件
添加用户
[root@localhost elk]# adduser es
设定密码
[root@localhost elk]# passwd es
添加权限
[root@localhost elk]# chown -R es /opt/elasticsearch-7.4.2
修改配置文件
进入 /opt/elasticsearch-7.4.2/config/,修改elasticsearch.yml文件
[root@localhost ~]# cd /opt/elasticsearch-7.4.2/config/
取消如下注释,并修改为当前主机地址:
cluster.name: my-application

node.name: node-1

bootstrap.memory_lock: false

network.host: 192.168.75.143

http.port: 9200

discovery.zen.ping.unicast.hosts: ["192.168.75.143"]
discovery.zen.minimum_master_nodes: 1 #注意,因为本人目前是单节点,这里必须为1
新增如下配置:
transport.tcp.port: 9300
transport.tcp.compress: true
bootstrap.system_call_filter: false
使用vi编辑器,修改/etc/sysctl.conf文件,添加如下代码(若无将会出现下面常见问题2):
vm.max_map_count=262144
退出保存后执行如下命令:
sysctl -p
修改/etc/security/limits.conf文件,在文件末尾添加如下代码(若无将会出现下面常见问题3):
# es为登录服务器的用户名
essoft nofile 65536
eshard nofile 65536
essoft nproc  4096
eshard nproc  4096
3、启动Elasticsearch
切换用户
su solin
查看当前用户
who am i
启动服务
[es@localhost ~]$ /opt/elasticsearch-7.4.2/bin/elasticsearch
后台启动
[es@localhost ~]$ /opt/elasticsearch-7.4.2/bin/elasticsearch -d
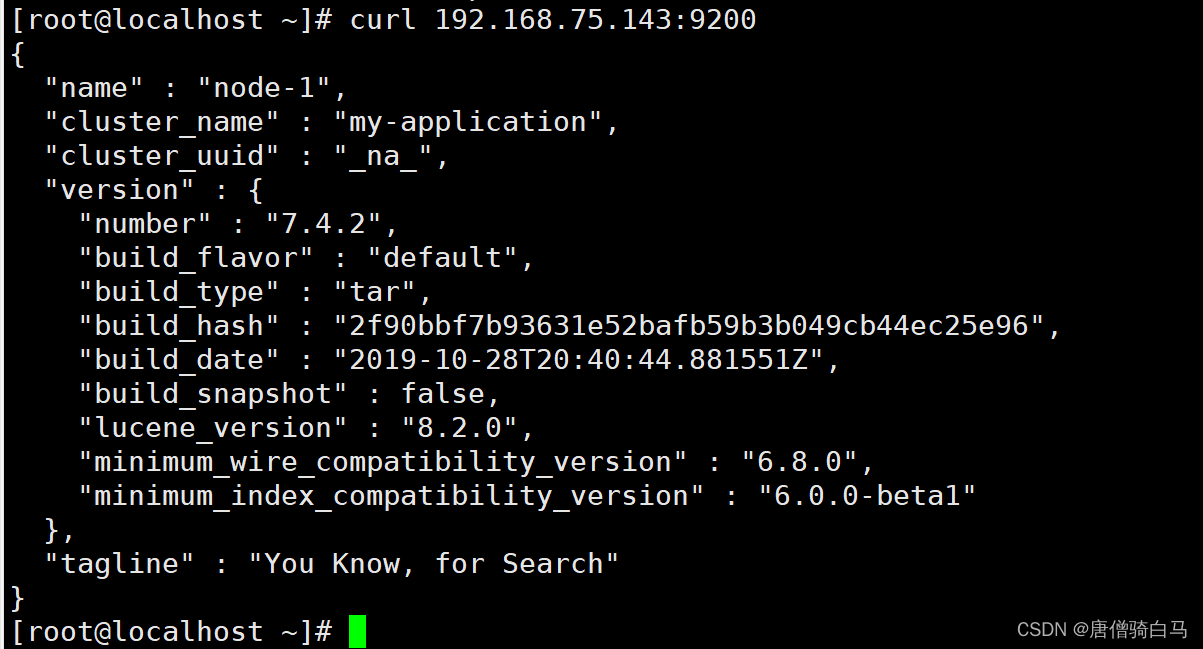
测试是否启动成功
[root@localhost ~]# curl 192.168.75.143:9200
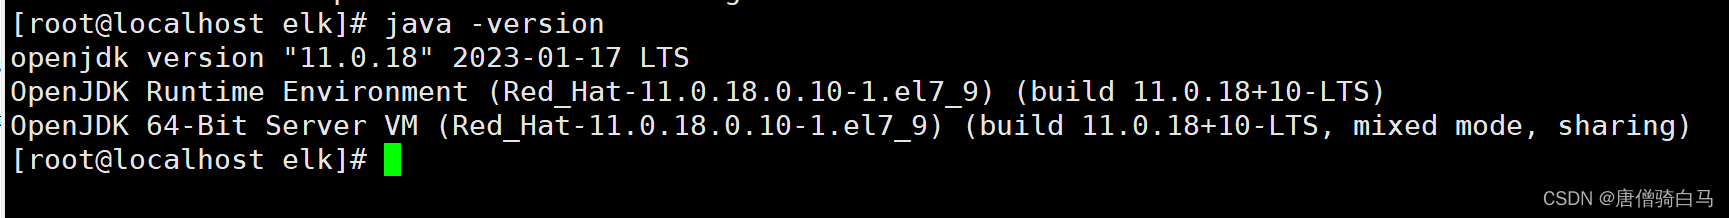
报错:需要按照JAVA11
future versions of Elasticsearch will require Java 11; your Java version from [/usr/lib/jvm/java-1.8.0-openjdk-1.8.0.362.b08-1.el7_9.x86_64/jre] does not meet this requirement
选择11版本
[es@localhost ~]$ yum search java| grep jdk
[root@localhost elk]# yum install java-11-openjdk-devel.x86_64
java环境配置参考:https://www.voidking.com/dev-install-jdk-on-all-platforms/
export JAVA_HOME=/usr/lib/jvm/java-11-openjdk-11.0.12.0.7-0.el7_9.x86_64
export CLASSPATH=$JAVA_HOME/lib:$CLASSPATH
export PATH=$JAVA_HOME/bin:$PATH
报错2:
could not find java in JAVA_HOME or bundled at /usr/lib/jvm/java-1.8.0/bin/java
解决办法:
切换到普通用户es下,执行source /etc/profile刷新配置
报错3:
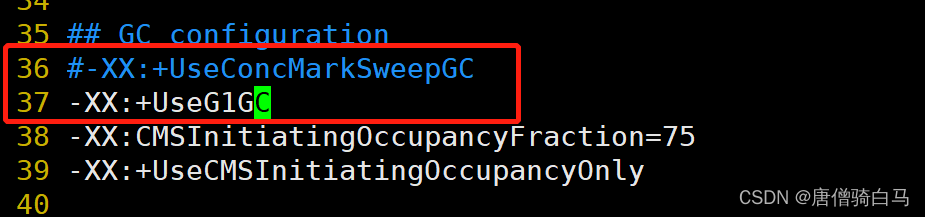
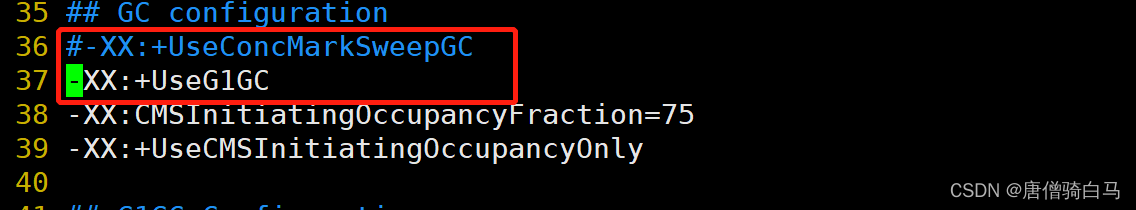
OpenJDK 64-Bit Server VM warning: Option UseConcMarkSweepGC was deprecated in version 9.0 and will likely be removed in a future release.
警告信息不影响es的启动,如果要去掉警告,则需要修改es config下面的jvm.options文件中的属性定义字段,把-XX:+UseConcMarkSweepGC修改成:
[root@localhost config]# vim jvm.options
-XX:+UseG1GC
设置允许其他机器访问
当前只能响应本机的请求,想要其他机器也能访问的话,那么需要修改elasticsearch的配置。
[root@localhost ~]# vim /opt/elasticsearch-7.4.2/config/elasticsearch.yml
# line 17, uncomment
cluster.name: my-application
# line 22, uncomment and change
node.name: master
# line 55, uncomment and change
network.host: 0.0.0.0
# line 59, uncomment
ttp.port: 9200
# line 72, uncomment and change
cluster.initial_master_nodes: ["master", "node-2"]
重启Elasticsearch
如果可以看到:::9200,就可以通过外部浏览器访问Elasticsearch服务了,至此Elasticsearch安装配置完成。
4、Logstash安装
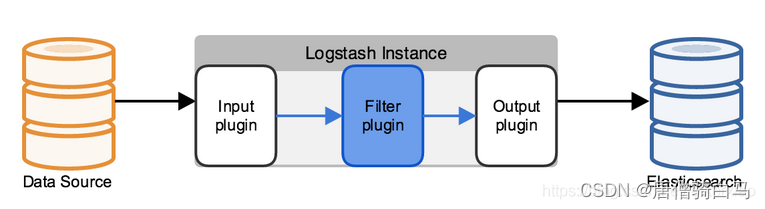
Logstash 工作原理
Logstash使用管道方式进行日志的搜集处理和输出。
有点类似Linux系统的管道命令 aaa| bbb | ccc,aaa执行完了会执行bbb,然后执行ccc。
在logstash中,包括了三个阶段:
输入input --> 处理filter(不是必须的) --> 输出output
配置文件也是按这个顺序进行配置的。
解压安装包到当前目录
[root@localhost elk]# tar zxvf logstash-7.4.2.tar.gz
移动安装目录到opt目录下
[root@localhost elk]# mv logstash-7.4.2 /opt
拷贝 config 目录下的 logstash-sample.conf,改名为 logstash.conf,修改其配置,内容如下:
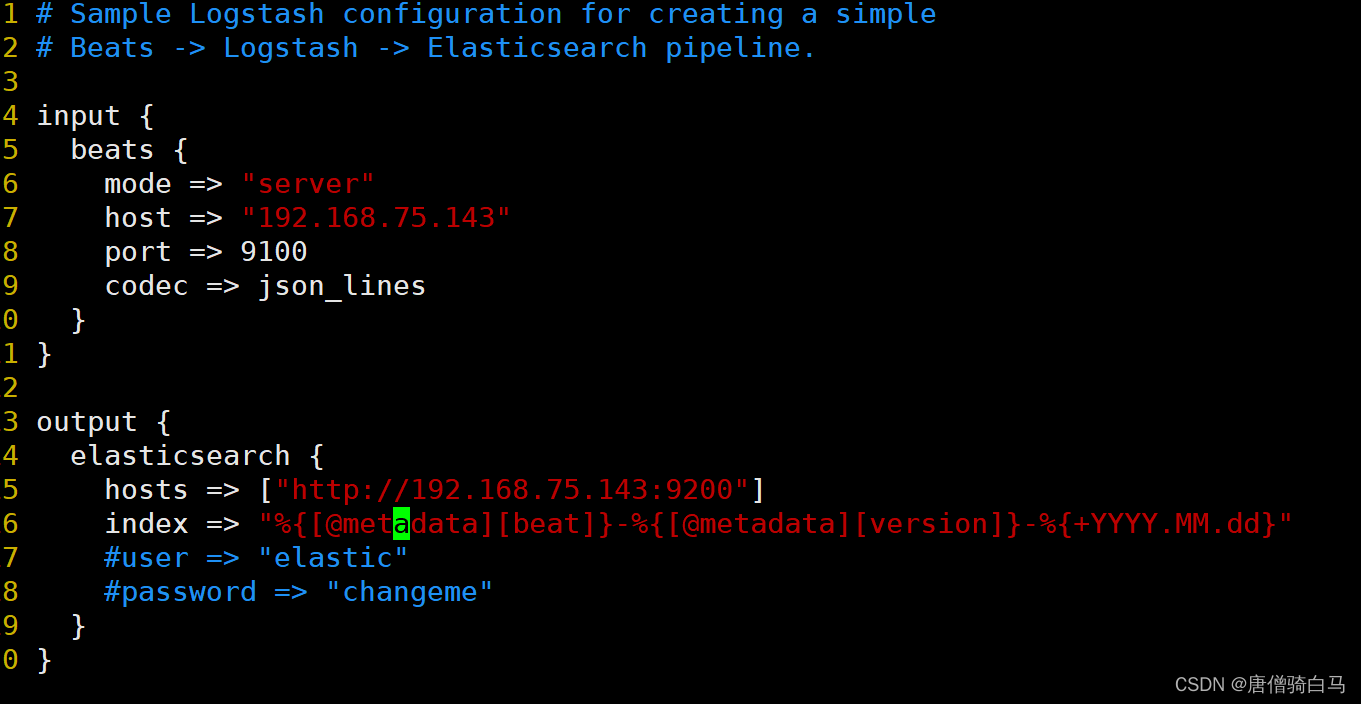
简单解释一下这段配置:
1、input 块是 logstash 接收日志时的一些配置,output 是 logstash 往 elasticsearch 输送日志的配置;
2、input.host 是运行 logstash 的服务器的 ip;input.port 是 logstash 的运行端口,可以自己定义;
3、output.hosts 的 elasticsearch 的 ip 和端口,这是个数组,多个用逗号隔开,由于我们没有修改 elasticsearch 的配置,它默认就是 9200 端口;output.index 是索引;
4、修改完配置,进入 bin 目录指定配置文件启动即可,例如:./logstash -f ../config/logstash.conf,如果是 windows 版本,执行logstash.bat -f …/config/logstash.conf即可。
[root@localhost bin]# ./logstash -f ../config/logstash.conf
5、kibana安装
下载后解压,然后拷贝一份 config 目录下的 kibana.yml,根据自己的需要可以修改配置,比如端口(默认5601)、host、elasticsearch.hosts(默认localhost:9200)等。我这里都用默认的,没有修改。
到 bin 目录下执行 ./kibana就可以启动了,windows 执行 kibana.bat即可。
启动完访问 localhost:5601,看到如下界面就启动成功了。

kibana.yml配置文件常用配置说明
server.port:
    默认值: 5601 Kibana 由后端服务器提供服务,该配置指定使用的端口号。
server.host:
    默认值: "localhost" 指定后端服务器的主机地址。
server.basePath:
    如果启用了代理,指定 Kibana 的路径,该配置项只影响 Kibana 生成的 URLs,转发请求到 Kibana 时代理会移除基础路径值,该配置项不能以斜杠 (/)结尾。
server.maxPayloadBytes:
    默认值: 1048576 服务器请求的最大负载,单位字节。
server.name:
    默认值: "您的主机名" Kibana 实例对外展示的名称。
server.defaultRoute:
    默认值: "/app/kibana" Kibana 的默认路径,该配置项可改变 Kibana 的登录页面。
elasticsearch.url:
    默认值: "http://localhost:9200" 用来处理所有查询的 Elasticsearch 实例的 URL 。
elasticsearch.preserveHost:
    默认值: true 该设置项的值为 true 时,Kibana 使用 server.host 设定的主机名,该设置项的值为 false 时,Kibana 使用主机的主机名来连接 Kibana 实例。
kibana.index:
    默认值: ".kibana" Kibana 使用 Elasticsearch 中的索引来存储保存的检索,可视化控件以及仪表板。如果没有索引,Kibana 会创建一个新的索引。
kibana.defaultAppId:
    默认值: "discover" 默认加载的应用。
tilemap.url:
    Kibana 用来在 tile 地图可视化组件中展示地图服务的 URL。默认时,Kibana 从外部的元数据服务读取 url,用户也可以覆盖该参数,使用自己的 tile 地图服务。例如:"https://tiles.elastic.co/v2/default/{z}/{x}/{y}.png?elastic_tile_service_tos=agree&my_app_name=kibana"
tilemap.options.minZoom:
    默认值: 1 最小缩放级别。
tilemap.options.maxZoom:
    默认值: 10 最大缩放级别。
tilemap.options.attribution:
    默认值: "© [Elastic Tile Service](https://www.elastic.co/elastic-tile-service)" 地图属性字符串。
tilemap.options.subdomains:
    服务使用的二级域名列表,用 {s} 指定二级域名的 URL 地址。
elasticsearch.username: 和 elasticsearch.password:
    Elasticsearch 设置了基本的权限认证,该配置项提供了用户名和密码,用于 Kibana 启动时维护索引。Kibana 用户仍需要 Elasticsearch 由 Kibana 服务端代理的认证。
server.ssl.enabled
    默认值: "false" 对到浏览器端的请求启用 SSL,设为 true 时, server.ssl.certificate 和 server.ssl.key 也要设置。
server.ssl.certificate: 和 server.ssl.key:
    PEM 格式 SSL 证书和 SSL 密钥文件的路径。
server.ssl.keyPassphrase
    解密私钥的口令,该设置项可选,因为密钥可能没有加密。
server.ssl.certificateAuthorities
    可信任 PEM 编码的证书文件路径列表。
server.ssl.supportedProtocols
    默认值: TLSv1、TLSv1.1、TLSv1.2 版本支持的协议,有效的协议类型: TLSv1 、 TLSv1.1 、 TLSv1.2 。
server.ssl.cipherSuites
    默认值: ECDHE-RSA-AES128-GCM-SHA256, ECDHE-ECDSA-AES128-GCM-SHA256, ECDHE-RSA-AES256-GCM-SHA384, ECDHE-ECDSA-AES256-GCM-SHA384, DHE-RSA-AES128-GCM-SHA256, ECDHE-RSA-AES128-SHA256, DHE-RSA-AES128-SHA256, ECDHE-RSA-AES256-SHA384, DHE-RSA-AES256-SHA384, ECDHE-RSA-AES256-SHA256, DHE-RSA-AES256-SHA256, HIGH,!aNULL, !eNULL, !EXPORT, !DES, !RC4, !MD5, !PSK, !SRP, !CAMELLIA. 具体格式和有效参数可通过[OpenSSL cipher list format documentation](https://www.openssl.org/docs/man1.0.2/apps/ciphers.html#CIPHER-LIST-FORMAT) 获得。
elasticsearch.ssl.certificate: 和 elasticsearch.ssl.key:
    可选配置项,提供 PEM格式 SSL 证书和密钥文件的路径。这些文件确保 Elasticsearch 后端使用同样的密钥文件。
elasticsearch.ssl.keyPassphrase
    解密私钥的口令,该设置项可选,因为密钥可能没有加密。
elasticsearch.ssl.certificateAuthorities:
    指定用于 Elasticsearch 实例的 PEM 证书文件路径。
elasticsearch.ssl.verificationMode:
    默认值: full 控制证书的认证,可用的值有 none 、 certificate 、 full 。 full 执行主机名验证,certificate 不执行主机名验证。
elasticsearch.pingTimeout:
    默认值: elasticsearch.requestTimeout setting 的值,等待 Elasticsearch 的响应时间。
elasticsearch.requestTimeout:
    默认值: 30000 等待后端或 Elasticsearch 的响应时间,单位微秒,该值必须为正整数。
elasticsearch.requestHeadersWhitelist:
    默认值: [ 'authorization' ] Kibana 客户端发送到 Elasticsearch 头体,发送 no 头体,设置该值为[]。
elasticsearch.customHeaders:
    默认值: {} 发往 Elasticsearch的头体和值, 不管 elasticsearch.requestHeadersWhitelist 如何配置,任何自定义的头体不会被客户端头体覆盖。
elasticsearch.shardTimeout:
    默认值: 0 Elasticsearch 等待分片响应时间,单位微秒,0即禁用。
elasticsearch.startupTimeout:
    默认值: 5000 Kibana 启动时等待 Elasticsearch 的时间,单位微秒。
pid.file:
    指定 Kibana 的进程 ID 文件的路径。
logging.dest:
    默认值: stdout 指定 Kibana 日志输出的文件。
logging.silent:
    默认值: false 该值设为 true 时,禁止所有日志输出。
logging.quiet:
    默认值: false 该值设为 true 时,禁止除错误信息除外的所有日志输出。
logging.verbose
    默认值: false 该值设为 true 时,记下所有事件包括系统使用信息和所有请求的日志。
ops.interval
    默认值: 5000 设置系统和进程取样间隔,单位微妙,最小值100。
status.allowAnonymous
    默认值: false 如果启用了权限,该项设置为 true 即允许所有非授权用户访问 Kibana 服务端 API 和状态页面。
cpu.cgroup.path.override
    如果挂载点跟 /proc/self/cgroup 不一致,覆盖 cgroup cpu 路径。
cpuacct.cgroup.path.override
    如果挂载点跟 /proc/self/cgroup 不一致,覆盖 cgroup cpuacct 路径。
console.enabled
    默认值: true 设为 false 来禁用控制台,切换该值后服务端下次启动时会重新生成资源文件,因此会导致页面服务有点延迟。
elasticsearch.tribe.url:
    Elasticsearch tribe 实例的 URL,用于所有查询。
elasticsearch.tribe.username: 和 elasticsearch.tribe.password:
    Elasticsearch 设置了基本的权限认证,该配置项提供了用户名和密码,用于 Kibana 启动时维护索引。Kibana 用户仍需要 Elasticsearch 由 Kibana 服务端代理的认证。
elasticsearch.tribe.ssl.certificate: 和 elasticsearch.tribe.ssl.key:
    可选配置项,提供 PEM 格式 SSL 证书和密钥文件的路径。这些文件确保 Elasticsearch 后端使用同样的密钥文件。
elasticsearch.tribe.ssl.keyPassphrase
    解密私钥的口令,该设置项可选,因为密钥可能没有加密。
elasticsearch.tribe.ssl.certificateAuthorities:
    指定用于 Elasticsearch tribe 实例的 PEM 证书文件路径。
elasticsearch.tribe.ssl.verificationMode:
    默认值: full 控制证书的认证,可用的值有 none 、 certificate 、 full 。 full 执行主机名验证, certificate 不执行主机名验证。
elasticsearch.tribe.pingTimeout:
    默认值: elasticsearch.tribe.requestTimeout setting 的值,等待 Elasticsearch 的响应时间。
elasticsearch.tribe.requestTimeout:
    Default: 30000 等待后端或 Elasticsearch 的响应时间,单位微秒,该值必须为正整数。
elasticsearch.tribe.requestHeadersWhitelist:
    默认值: [ 'authorization' ] Kibana 发往 Elasticsearch 的客户端头体,发送 no 头体,设置该值为[]。
elasticsearch.tribe.customHeaders:
    默认值: {} 发往 Elasticsearch的头体和值,不管 elasticsearch.tribe.requestHeadersWhitelist 如何配置,任何自定义的头体不会被客户端头体覆盖。
报错1:
FATAL [master_not_discovered_exception] null :: {"path":"/.kibana_task_manager","query":{},"statusCode":503,"response":"{\"error\":{\"root_cause\":[{\"type\":\"master_not_discovered_exception\",\"reason\":null}],\"type\":\"master_not_discovered_exception\",\"reason\":null},\"status\":503}"}
原因:未修改elasticsearch.yml的cluster.initial_master_nodes配置,修改配置之后重启elasticsearch
node.name: node-1
cluster.initial_master_nodes: [“node-1”]
报错2:Request Timeout after 30000ms
解决办法 :
方法1、修改elastisearch的内存
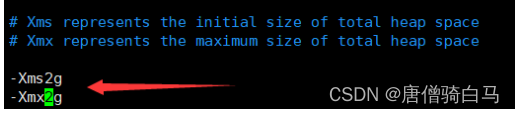
方法2、修改kibana的超时时间
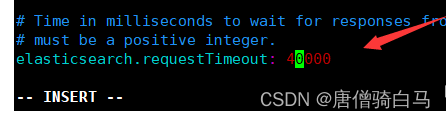
如果机器的内存不是那么的充足的话,我们可以改改后端弹性搜索的阈值。修改配置文件/etc/kibana/kibana.yml的第66行,将#去掉,然后将30000毫秒(也就是30s)
更改成40000(40秒),这个根据实际情况进行修改。
报错3:
fs.js:115
    throw err;
    ^

Error: EACCES: permission denied, open '/opt/kibana-7.4.2-linux-x86_64/optimize/.babel_register_cache.json'
    at Object.openSync (fs.js:439:3)
    at Object.writeFileSync (fs.js:1190:35)
    at save (/opt/kibana-7.4.2-linux-x86_64/node_modules/@babel/register/lib/cache.js:52:15)
    at process._tickCallback (internal/process/next_tick.js:61:11)
    at Function.Module.runMain (internal/modules/cjs/loader.js:745:11)
    at startup (internal/bootstrap/node.js:283:19)
    at bootstrapNodeJSCore (internal/bootstrap/node.js:743:3)
解决办法:赋予普通用户文件权限
chown -R kibana /opt/kibana-7.4.2-linux-x86_64/optimize/.babel_register_cache.json
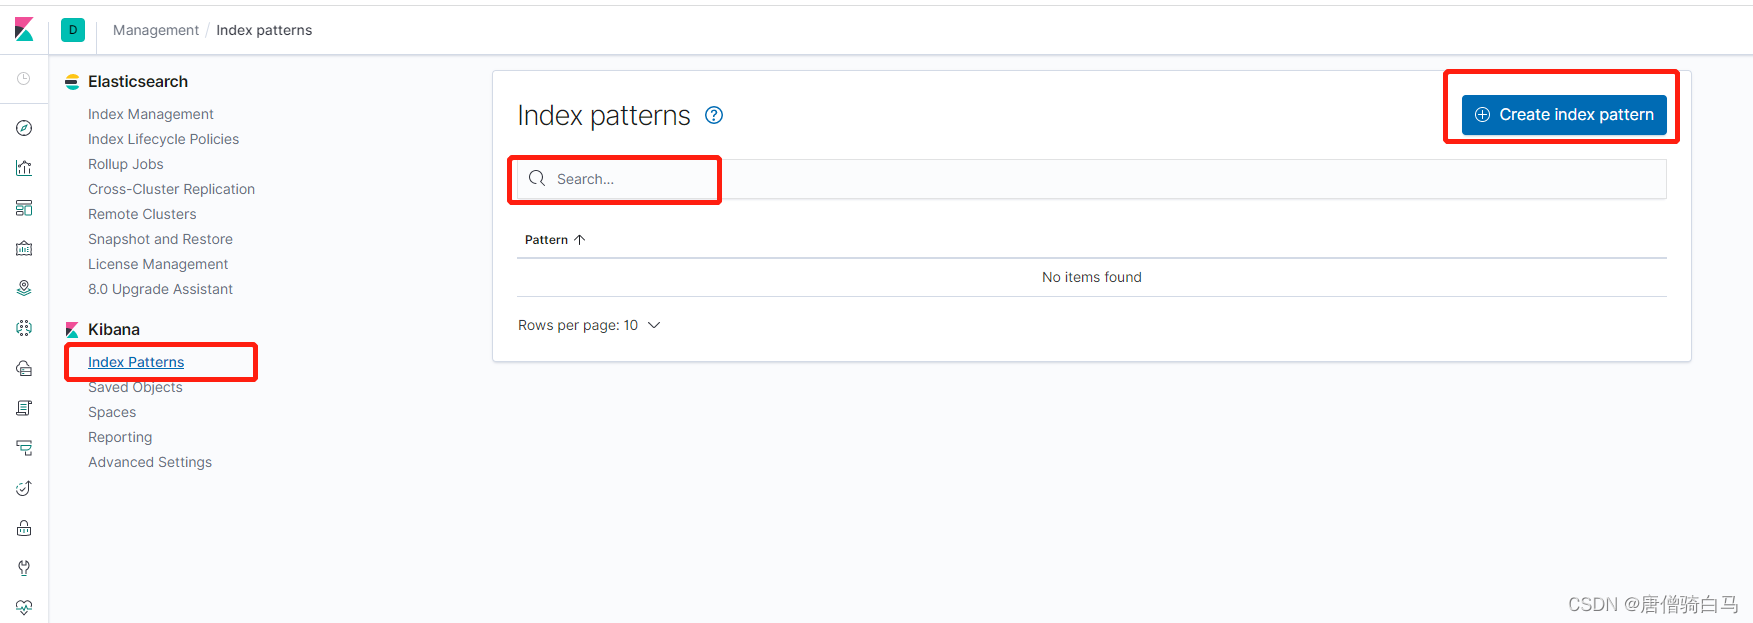
在kibana中查询日志
访问localhost:5601,点击左侧最下方图标【Management】–> 【Index Patterns】–> 【Create index pattern】
6、logstash深入收集Nginx日志
安装nginx
[root@localhost nginx]# yum -y install nginx
echo "192.168.75.143" > /usr/share/nginx/html/index.html
住nginx.conf配置
[root@localhost nginx]# cat nginx.conf
# For more information on configuration, see:
#   * Official English Documentation: http://nginx.org/en/docs/
#   * Official Russian Documentation: http://nginx.org/ru/docs/

user nginx;
worker_processes auto;
error_log /var/log/nginx/error.log;
pid /run/nginx.pid;

# Load dynamic modules. See /usr/share/doc/nginx/README.dynamic.
include /usr/share/nginx/modules/*.conf;

events {
    worker_connections 1024;
}

http {
   # log_format  main  '$remote_addr - $remote_user [$time_local] "$request" '
   #                   '$status $body_bytes_sent "$http_referer" '
   #                   '"$http_user_agent" "$http_x_forwarded_for"';

   log_format access_json '{"@timestamp":"$time_iso8601",'
        '"host":"$server_addr",'
        '"clientip":"$remote_addr",'
        '"size":$body_bytes_sent,'
        '"responsetime":$request_time,'
        '"upstreamtime":"$upstream_response_time",'
        '"upstreamhost":"$upstream_addr",'
        '"http_host":"$host",'
        '"url":"$uri",'
        '"domain":"$host",'
        '"xff":"$http_x_forwarded_for",'
        '"referer":"$http_referer",'
        '"status":"$status"}';

    #access_log  /var/log/nginx/access.log  main;
    access_log  /var/log/nginx/access.log access_json;

    sendfile            on;
    tcp_nopush          on;
    tcp_nodelay         on;
    keepalive_timeout   65;
    types_hash_max_size 4096;

    include             /etc/nginx/mime.types;
    default_type        application/octet-stream;
    include /etc/nginx/conf.d/*.conf;
server {
        listen       80;
        listen       [::]:80;
        server_name  _;
        root         /usr/share/nginx/html;

        # Load configuration files for the default server block.
        include /etc/nginx/default.d/*.conf;

        error_page 404 /404.html;
        location = /404.html {
        }

        error_page 500 502 503 504 /50x.html;
        location = /50x.html {
        }
    }
将Nginx日志转换成json格式
log_format access_json '{"@timestamp":"$time_iso8601",'
        '"host":"$server_addr",'
        '"clientip":"$remote_addr",'
        '"size":$body_bytes_sent,'
        '"responsetime":$request_time,'
        '"upstreamtime":"$upstream_response_time",'
        '"upstreamhost":"$upstream_addr",'
        '"http_host":"$host",'
        '"url":"$uri",'
        '"domain":"$host",'
        '"xff":"$http_x_forwarded_for",'
        '"referer":"$http_referer",'
        '"status":"$status"}';

    access_log  /var/log/nginx/access.log access_json;
重启nginx,查看访问日志
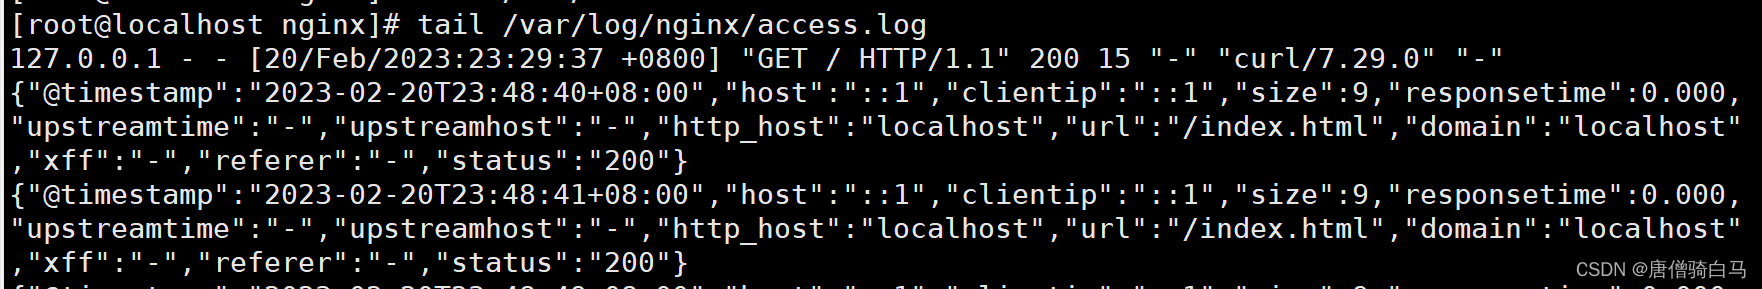
刷新页面会在日志看到访问日志信息为json格式即可,配置logstash收集Nginx日志
[root@localhost config]# cat nginx-log-es.conf
input{
  file{
    path => "/var/log/nginx/access.log"
    start_position => "beginning"
    stat_interval => 3
    type => "nginx-accesslog"
    codec => "json"
  }
}

output{
  if [type] == "nginx-accesslog"{
    elasticsearch {
      hosts => ["192.168.75.143:9200"]
      index => "long-nginx-accesslog-%{+YYYY.MM.dd}"
  }}
}
检查语法
/opt/logstash-7.4.2/bin/logstash -f /opt/logstash-7.4.2/config/nginx-log-es.conf -t
启动
/opt/logstash-7.4.2/bin/logstash -f /opt/logstash-7.4.2/config/nginx-log-es.conf
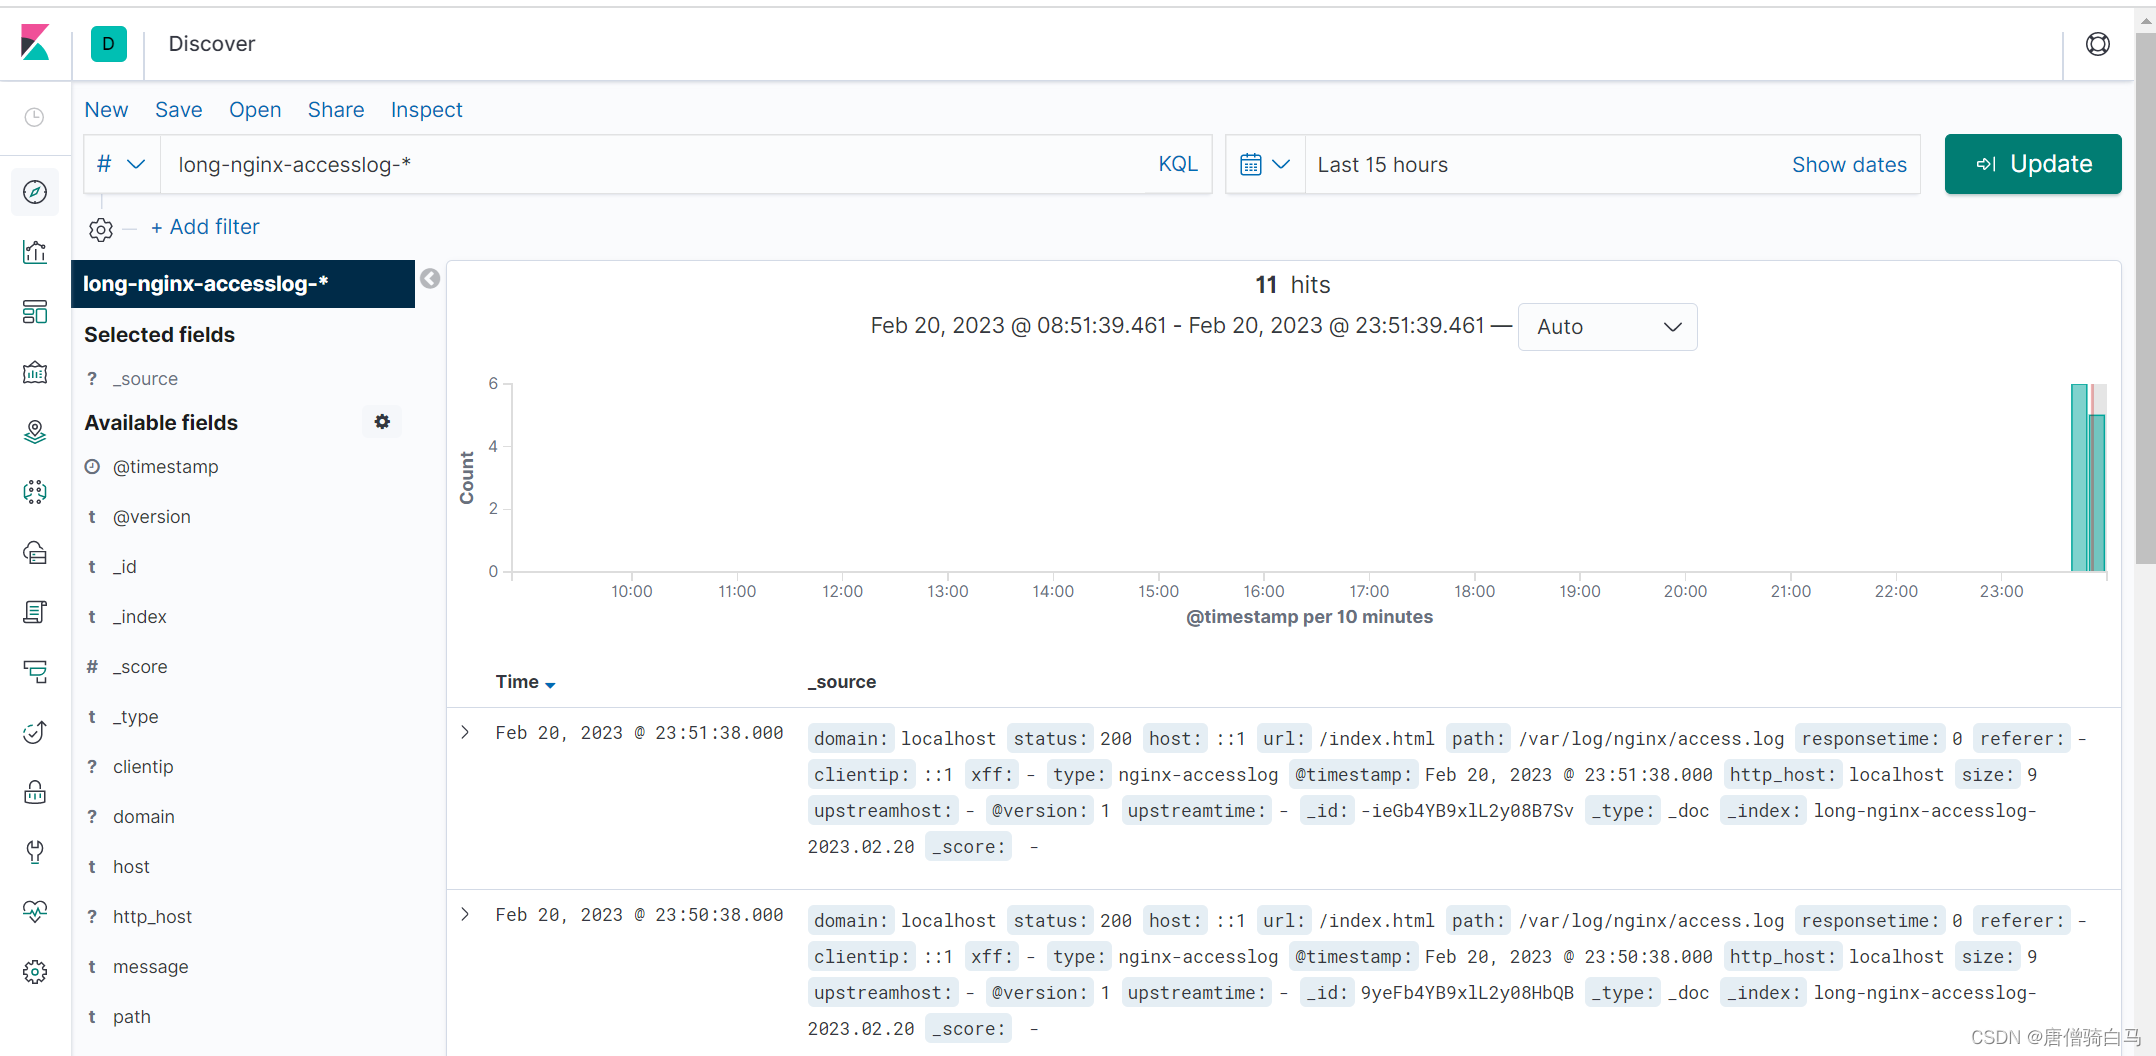
查看kabana
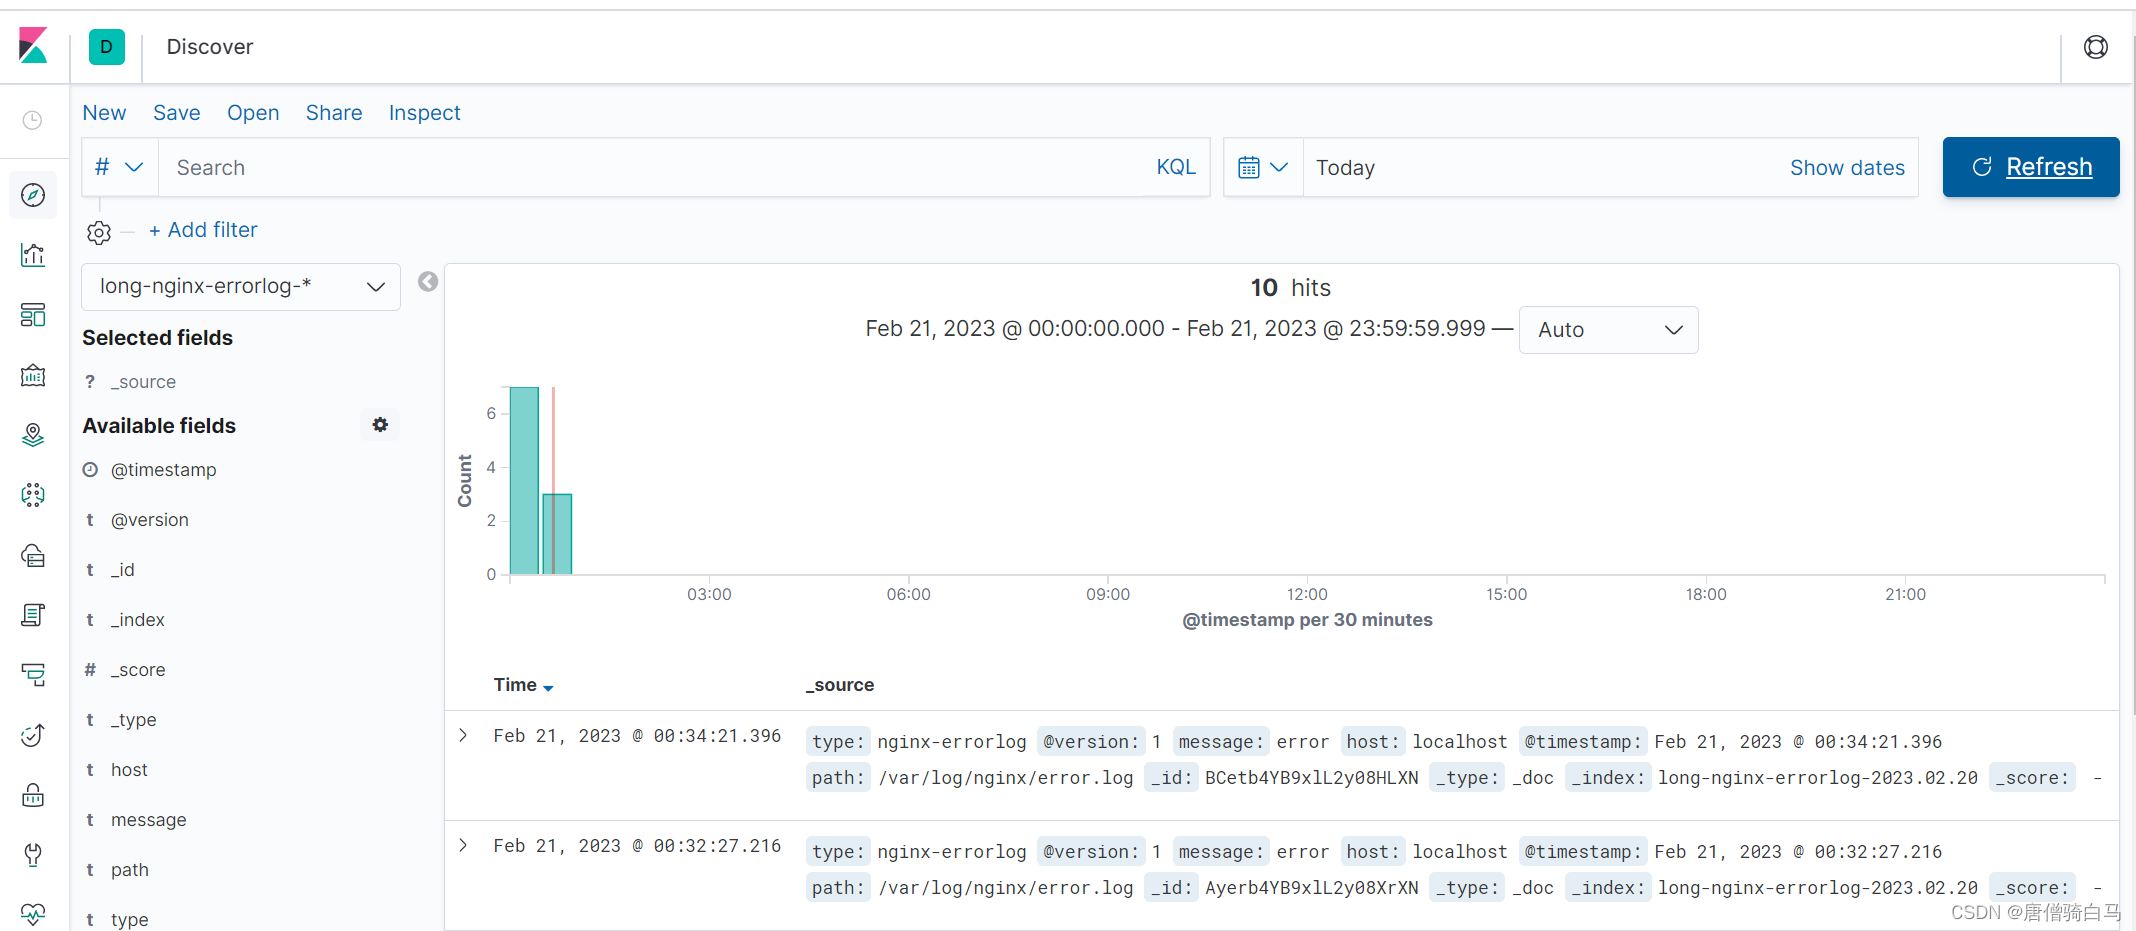
把nginx的访问日志和错误日志一起收集,配置文件
[root@localhost config]# cat nginx-log-es.conf
input{
  file{
    path => "/var/log/nginx/access.log"
    start_position => "beginning"
    stat_interval => 3
    type => "nginx-accesslog"
    codec => "json"
  }

  file{
    path => "/var/log/nginx/error.log"
    start_position => "beginning"
    stat_interval => 3
    type => "nginx-errorlog"
    #codec => "json"
  }
}

output{
  if [type] == "nginx-accesslog"{
    elasticsearch {
      hosts => ["192.168.75.143:9200"]
      index => "long-nginx-accesslog-%{+YYYY.MM.dd}"
  }}

   if [type] == "nginx-errorlog"{
    elasticsearch {
      hosts => ["192.168.75.143:9200"]
      index => "long-nginx-errorlog-%{+YYYY.MM.dd}"
  }}
}
检查语法
/opt/logstash-7.4.2/bin/logstash -f /opt/logstash-7.4.2/config/nginx-log-es.conf -t
启动
/opt/logstash-7.4.2/bin/logstash -f /opt/logstash-7.4.2/config/nginx-log-es.conf
查看错误日志


 1111
1111


 被折叠的 条评论
为什么被折叠?
被折叠的 条评论
为什么被折叠?
 到【灌水乐园】发言


