


实际上是饼图pie
option配置
setOption2() {
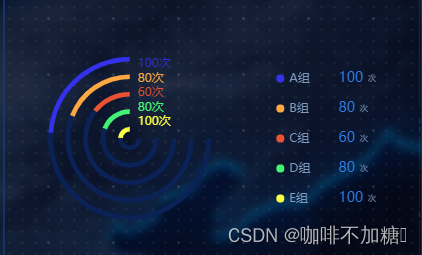
let color = ["#3531EA","#FFA842", "#EA5231", "#42F474", "#FBFF42"];
let chartData = [
{
name: "A组",
value: 100,
unit: "次"
},
{
name: "B组",
value: 80,
unit: "次"
},
{
name: "C组",
value: 60,
unit: "次"
},
{
name: "D组",
value: 80,
unit: "次"
},
{
name: "E组",
value: 100,
unit: "次"
}
];
let arrName = [];
let arrValue = [];
let sum = 0;
let pieSeries = [],
lineYAxis = [];
// 数据处理
chartData.forEach((v, i) => {
arrName.push(v.name);
arrValue.push(v.value);
sum = sum + v.value;
});
// 图表option整理
chartData.forEach((v, i) => {
pieSeries.push({
name: "班组工时",
type: "pie",
clockWise: false,
radius: [66 - i * 15 + "%", 70 - i * 15 + "%"],
center: ["30%", "50%"],
label: {
show: false
},
data: [
{
value: v.value,
name: v.name
},
{
value: sum - v.value,
name: "",
itemStyle: {
color: "rgba(11,31,62,0)"
}
}
]
});
pieSeries.push({
name: "",
type: "pie",
silent: true,
z: 1,
clockWise: false, //顺时加载
radius: [66 - i * 15 + "%", 70 - i * 15 + "%"],
center: ["30%", "50%"],
label: {
show: false
},
data: [
{
value: 7.5,
itemStyle: {
color: "#0A2257"
}
},
{
value: 2.5,
name: "",
itemStyle: {
color: "rgba(11,31,62,0)"
}
}
]
});
v.percent = ((v.value / sum) * 100).toFixed(1) + "%";
lineYAxis.push({
value: i,
textStyle: {
padding:[5,0,5,0],
color: color[i],
}
});
});
this.option2 = {
backgroundColor: "rgba(4,10,33,0.1)",
color: color,
grid: {
top: "15%",
bottom: "54%",
left: "30%",
containLabel: false
},
legend: {
show: true,
orient: "vertical",
top: "middle",
icon: "circle",
right: '10%',
itemWidth: 8,
itemHeight: 8,
data: chartData,
formatter: function (v) {
let value = chartData.filter((item) => {
return item.name == v;
})[0].value;
return `{a|${v}} {b|${value}}{c|次}`;
},
textStyle: {
color: "auto",
fontSize: 14,
rich: {
a: {
width: 40,
color: "#809ABE",
fontSize: 12,
height: 20
},
b: {
color: "#317EEA",
fontSize: 14,
padding: [0, 5, 0, 5]
},
c: {
color: "#809ABE",
fontSize: 8
}
}
}
},
yAxis: [
{
type: "category",
inverse: true,
axisLine: {
show: false
},
axisTick: {
show: false
},
axisLabel: {
formatter: function (params) {
let item = chartData[params];
return "{circle|}{value|" + item.value + "}次";
// return (
// "{line|}{circle|●}{name|" +
// item.name +
// "}{bd||}{percent|" +
// item.percent +
// "}{value|" +
// item.value +
// "}{unit|次}"
// );
},
interval: 0,
inside: true,
textStyle: {
color: "auto",
fontSize: 12,
rich: {
value: {
fontSize: 12,
},
unit: {
fontSize: 12,
}
}
},
show: true,
},
data: lineYAxis
}
],
xAxis: [
{
show: false
}
],
series: pieSeries
};
},
调用
this.chartColumn2 = ECharts.init(this.$refs.chartColumn2);
this.setOption2();
this.chartColumn2.setOption(this.option2);


 1303
1303


 被折叠的 条评论
为什么被折叠?
被折叠的 条评论
为什么被折叠?
 到【灌水乐园】发言


