


<template>
<div class="wrapper">
<div ref="chartColumn" class="ecahrts-main"></div>
</div>
</template>
<script>
import * as ECharts from 'echarts'
export default {
name: "",
data() {
return {
option: {}
};
},
mounted() {
this.initChart();
},
methods: {
setOptions() {
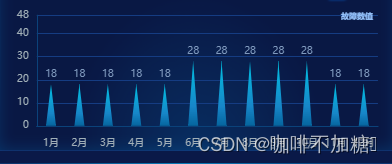
const resData1 = [18,18,18,18,18,28,28,28,28,28,18,18];
const itemStyle= {
};
this.option = {
title: {
text: "故障数值",
textStyle:{
color:'#99C6FF',
fontSize:8,
},
right:'5%',
top:'5%'
},
grid: { left: "5%", right: "5%", bottom: "6%",top:'10%', containLabel: true },
xAxis: {
type: "category",
offset: 5,
axisLabel: {
show: true,
interval: 0,
color: "#A2B0B8",
fontSize:10,
},
data: ['1月', '2月', '3月', '4月', '5月','6月', '7月', '8月', '9月', '10月','11月', '12月'],
axisLine: {
show: true,
lineStyle: {
color: "#0B427A"
}
},
axisTick: {
show: false
},
},
yAxis: {
type: "value",
// offset: 30,
axisLine: {
show: true,
lineStyle: {
color: "#0B427A"
}
},
splitLine: {
show: true,
lineStyle:{
color:'#153C82'
}
},
axisTick: {
show: false
},
axisLabel: {
show: true,
color: "#A2B0B8",
formatter: "{value}",
fontSize:10,
},
max: function (value) {
return value.max + 20;
}
},
series: [
{
//数据柱子 (蓝色柱子)
name: "物资消耗情况",
data: resData1,
type: "pictorialBar",
barWidth: 10,
barGap: "200%",
showBackground: false,
symbol: 'triangle',
itemStyle: {
//lenged文本
opacity: 1,
color: {
type: "linear",
x: 0,
y: 0,
x2: 0,
y2: 1,
colorStops: [
{
offset: 0,
color: "#00C2E3" // 0% 处的颜色
},
{
offset: 0.7,
color: "rgba(23,134,200,1)" // 0% 处的颜色
},
{
offset: 1,
color: "#05659E" // 100% 处的颜色
}
]
}
},
// 柱子顶部显示值
label: {
show: true,
color:'#809ABE',
position: "top",
distance: 5,
formatter: "{c}",
fontSize:10,
}
},
]
};
},
initChart() {
this.chartColumn = ECharts.init(this.$refs.chartColumn);
this.setOptions();
this.chartColumn.setOption(this.option);
}
}
};
</script>
<style lang='scss' scoped>
.wrapper {
width: 20.07rem;
height: 7.65rem;
position: relative;
.ecahrts-main {
width: 20.07rem;
height: 7.65rem;
}
}
</style>


 2572
2572


 被折叠的 条评论
为什么被折叠?
被折叠的 条评论
为什么被折叠?
 到【灌水乐园】发言


