


是一个高度模块化的系统
配置文件
prometheus.yml
- prometheus配置文件各个大配置段
- scrape_configs 采集配置段 做采集器
- rule_files 告警、预聚合配置文件段
- remote_read 远程查询段
- remote_write 远程写入段
- alerting: Alertmanager信息段
全局配置段(必写段)
# 全局配置段
global:
  # 采集间隔
  scrape_interval:     15s # Set the scrape interval to every 15 seconds. Default is every 1 minute.
  # 计算报警和预聚合间隔
  evaluation_interval: 15s # Evaluate rules every 15 seconds. The default is every 1 minute.
  # 采集超时时间
  scrape_timeout: 10s
  # 查询日志,包含各阶段耗时统计
  query_log_file: /opt/logs/prometheus_query_log
  # 全局标签组
  # 通过本实例采集的数据都会叠加下面的标签,在本地不会展示,都痛remote write写入时会在远端展示
  external_labels:
    account: 'huawei-main'
    region: 'beijng-01'
Alertmanager信息段
# Alertmanager信息段
alerting:
  alertmanagers:
  - scheme: http
    static_configs:
    - targets:
      - "localhost:9093"
告警、预聚合配置文件段
# 告警、预聚合配置文件段
# yml文件路径
rule_files:
    - /etc/prometheus/rules/record.yml
    - /etc/prometheus/rules/alert.yml
采集配置段
scrape_configs:
  # The job name is added as a label `job=<job_name>` to any timeseries scraped from this config.
  # 采集任务
  - job_name: 'prometheus'

    # metrics_path defaults to '/metrics'
    # scheme defaults to 'http'.
# 查询目标(端口)
    static_configs:
    - targets: ['localhost:9090']
采集段的解释
- prometheus的采集任务以job为单位
- prometheus充当http client 根据job中配置的schema等信息去target中配置的地址采集数据。target页面上可以看到相关的job

- 采集段中有很多配置项目,在页面上观察配置文件可以看到补全的信息
- job_name: prometheus
  # true代表使用原始数据的时间戳,false代表使用prometheus采集器的时间戳
  honor_timestamps: true
  # 多久执行一次采集,就是这个job 多久执行一次,默认15s,继承自全局配置
  scrape_interval: 15s
  # 采集的超时,默认15s,继承自全局配置
  scrape_timeout: 15s
  # 就是采集target的 metric暴露 http path,默认是/metrics ,比如探针型的就是/probe
  metrics_path: /metrics
  # 采集目标的协议 是否是https,https可配置是否跟踪证书校验等
  scheme: http
  # 是否跟踪 redirect
  follow_redirects: true
  static_configs:
  - targets:
    - localhost:9090
查看源码
- D:\go_path\src\github.com\prometheus\prometheus\config\config.go +380
- 可以看到全量的配置项
type ScrapeConfig struct {
	// The job name to which the job label is set by default.
	JobName string `yaml:"job_name"`
	// Indicator whether the scraped metrics should remain unmodified.
	HonorLabels bool `yaml:"honor_labels,omitempty"`
	// Indicator whether the scraped timestamps should be respected.
	HonorTimestamps bool `yaml:"honor_timestamps"`
	// A set of query parameters with which the target is scraped.
	Params url.Values `yaml:"params,omitempty"`
	// How frequently to scrape the targets of this scrape config.
	ScrapeInterval model.Duration `yaml:"scrape_interval,omitempty"`
	// The timeout for scraping targets of this config.
	ScrapeTimeout model.Duration `yaml:"scrape_timeout,omitempty"`
	// The HTTP resource path on which to fetch metrics from targets.
	MetricsPath string `yaml:"metrics_path,omitempty"`
	// The URL scheme with which to fetch metrics from targets.
	Scheme string `yaml:"scheme,omitempty"`
	// An uncompressed response body larger than this many bytes will cause the
	// scrape to fail. 0 means no limit.
	BodySizeLimit units.Base2Bytes `yaml:"body_size_limit,omitempty"`
	// More than this many samples post metric-relabeling will cause the scrape to
	// fail.
	SampleLimit uint `yaml:"sample_limit,omitempty"`
	// More than this many targets after the target relabeling will cause the
	// scrapes to fail.
	TargetLimit uint `yaml:"target_limit,omitempty"`
	// More than this many labels post metric-relabeling will cause the scrape to
	// fail.
	LabelLimit uint `yaml:"label_limit,omitempty"`
	// More than this label name length post metric-relabeling will cause the
	// scrape to fail.
	LabelNameLengthLimit uint `yaml:"label_name_length_limit,omitempty"`
	// More than this label value length post metric-relabeling will cause the
	// scrape to fail.
	LabelValueLengthLimit uint `yaml:"label_value_length_limit,omitempty"`

	// We cannot do proper Go type embedding below as the parser will then parse
	// values arbitrarily into the overflow maps of further-down types.

	ServiceDiscoveryConfigs discovery.Configs       `yaml:"-"`
	HTTPClientConfig        config.HTTPClientConfig `yaml:",inline"`

	// List of target relabel configurations.
	RelabelConfigs []*relabel.Config `yaml:"relabel_configs,omitempty"`
	// List of metric relabel configurations.
	MetricRelabelConfigs []*relabel.Config `yaml:"metric_relabel_configs,omitempty"`
}
- static_configs 段代表静态配置采集的端点
- 为何在上述ScrapeConfig配置段中没有找到 static_configs配置项,这又是怎么回事呢
源码搜索思路
-
在prometheus 源码目录搜索 static_configs
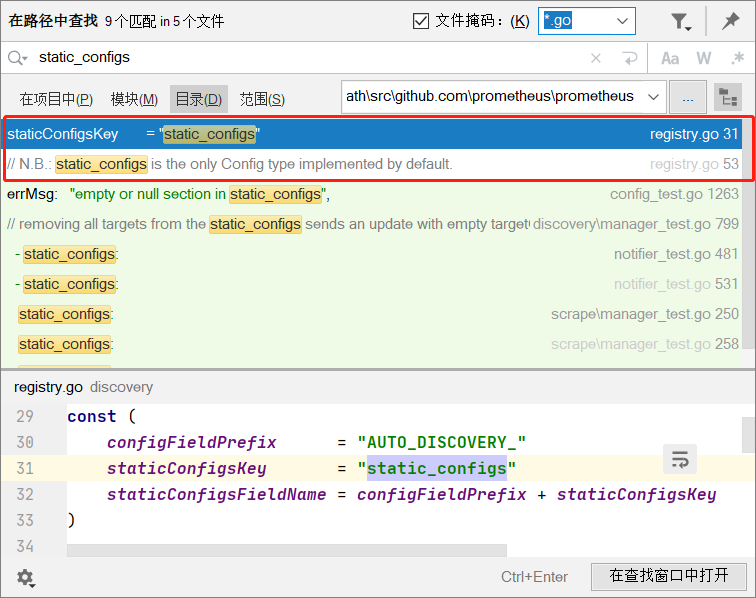
-
发现 在文件 D:\go_path\src\github.com\prometheus\prometheus\discovery\registry.go中有
-
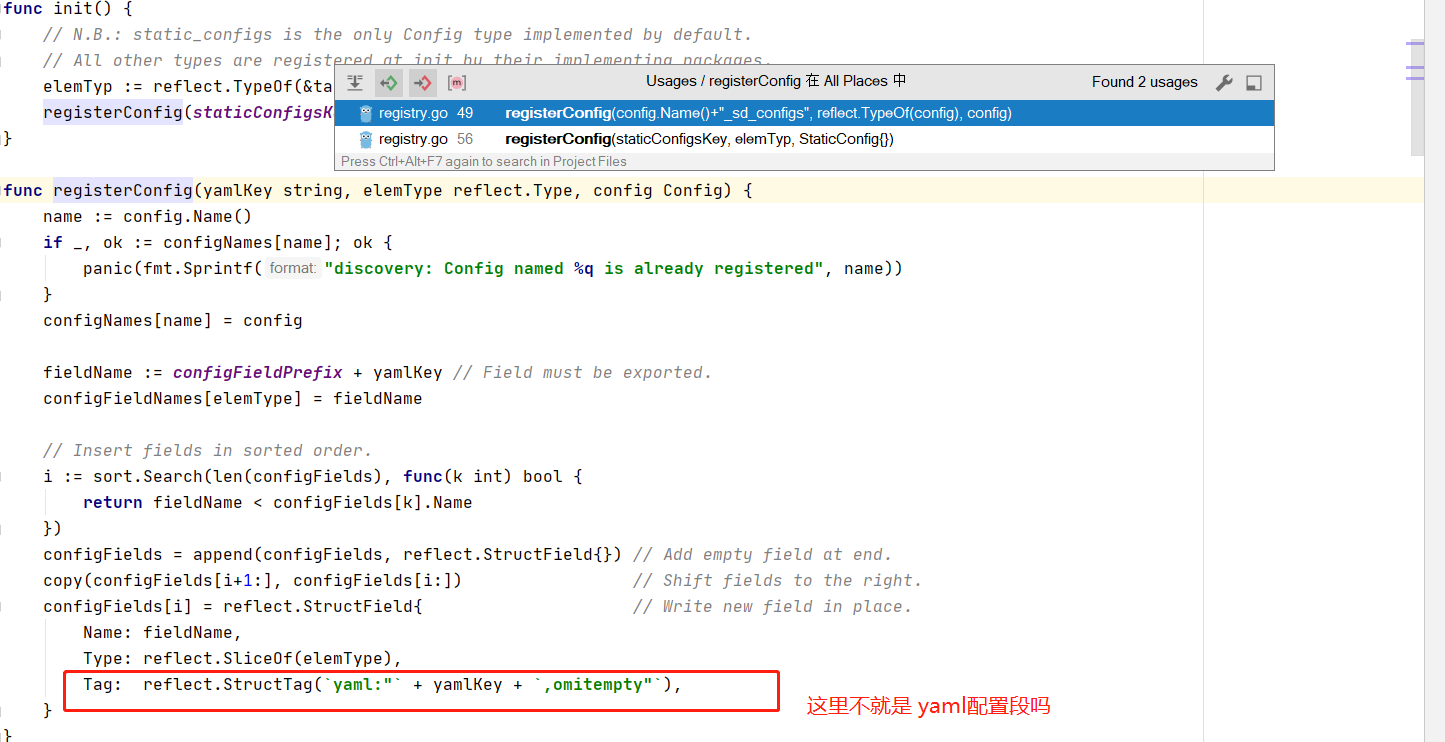
看到这里 在registry.go中 的init 函数会在包自动导入的时候注册static_configs 到configFields中
-
所有服务发现都会在各自包中的init方法自动注册自己
追查 configFields是干什么用的
- D:\go_path\src\github.com\prometheus\prometheus\config\config.go
- ScrapeConfig实现了 yaml的Unmarshaler接口 中的UnmarshalYAML方法
- 所以在yaml解析的时候 ScrapeConfig字段时会调用这个UnmarshalYAML方法
func (c *ScrapeConfig) UnmarshalYAML(unmarshal func(interface{}) error) error {
	*c = DefaultScrapeConfig
	if err := discovery.UnmarshalYAMLWithInlineConfigs(c, unmarshal); err != nil {
		return err
	}
- UnmarshalYAMLWithInlineConfigs中 调用 getConfigType
- getConfigType方法中操作了configFields结构体
- 总结:
- ScrapeConfig使用指定的UnmarshalYAML方法
- 当中会去判断采用的是静态配置还是 服务发现的
- 这样写的好处是不需要通过if-else判断,而且每种服务发现的配置是不一样的
远程查询段
# 配置远程查询数据存放位置(可以不放本地)
remote_read:
  # prometheus
  - url: http://prometheus/v1/read
    read_recent: true

  # m3db
  - url: "http://m3coordinator-read:7201/api/v1/prom/remote/read"
    read_recent: true
远程写入段
remote_write:
  - url: "http://m3coordinator-write:7201/api/v1/prom/remote/write"
    queue_config:
      capacity: 10000
      max_samples_per_send: 60000
    write_relabel_configs:
      - source_labels: [__name__]
        separator: ;
        # 标签key前缀匹配到的drop
        regex: '(kubelet_|apiserver_|container_fs_).*'
        replacement: $1
        action: drop
prometheus实例可以用来做下列用途
| 对应的配置段 | 用途 |
|---|---|
| 采集配置段 | 做采集器,数据保存在本地 |
| 采集配置段 + 远程写入段 | 做采集器+传输器,数据保存在本地+远端存储 |
| 远程查询段 | 做查询器,查询远端存储数据 |
| 采集配置段 + 远程查询段 | 做采集器+查询器,查询本地数据+远端存储数据 |
| 采集配置段 + Alertmanager信息段 + 告警配置文件段 | 做采集器+告警触发器,查询本地数据生成报警发往Alertmanager |
| 远程查询段 + Alertmanager信息段 + 告警配置文件段 | 做远程告警触发器,查询远端数据生成报警发往Alertmanager |
| 远程查询段+远程写入段 + 预聚合配置文件段 | 做预聚合指标,生成的结果集指标写入远端存储 |
命令行参数
- –web.listen-address 代表prometheus监听的地址,多个prometheus实例在一起时会争抢
- –storage.tsdb.path 本地tsdb存储位置
- –storage.tsdb.retention.time 代表数据保留时间 默认15天
- –web.enable-lifecycle代表开启热更新配置
prometheus 基本概念
- point 是时序中单一数据点的数据结构,大小 8+8=16byte
- 标签和标签组 key-value的字符串
- sample 时序曲线中的一个点
Point 数据点
- 源码位置 D:\nyy_work\go_path\src\github.com\prometheus\prometheus\promql\value.go
// Point represents a single data point for a given timestamp.
type Point struct {
	T int64  //8字节
	V float64
}
- 具体含义: 一个时间戳和一个value组合成的数据点
- size:16byte: 包含 1个8byte int64时间戳和1个8byte float64 value
- 举例图片

Label 标签
- 源码位置 D:\nyy_work\go_path\src\github.com\prometheus\prometheus\pkg\labels\labels.go
type Label struct {
	Name, Value string
}
- 一对label 比如
cpu="0"mode: "user" - 举例图片

Labels 标签组
- 源码位置 D:\nyy_work\go_path\src\github.com\prometheus\prometheus\pkg\labels\labels.go
type Labels []Label
- 是Label切片的别名
- 就是 一个指标的所有tag values
- 举例图片
sample 数据点
points + labels = sample
- 源码位置 D:\nyy_work\go_path\src\github.com\prometheus\prometheus\promql\value.go
// Sample is a single sample belonging to a metric.
type Sample struct {
	Point

	Metric labels.Labels
}
- sample代表一个数据点
- 举例图片
prometheus四种查询类型
-
4种查询类型
- vector 某一个时刻的结果
- matrix 某一段时间的结果
- scalar 浮点数
- string
-
查询模式
- instant query 对应vector
- range query 对应matrix
-
查询类型源码地址 D:\nyy_work\go_path\src\github.com\prometheus\prometheus\promql\parser\value.go
// The valid value types.
const (
	ValueTypeNone   ValueType = "none"
	ValueTypeVector ValueType = "vector"
	ValueTypeScalar ValueType = "scalar"
	ValueTypeMatrix ValueType = "matrix"
	ValueTypeString ValueType = "string"
)
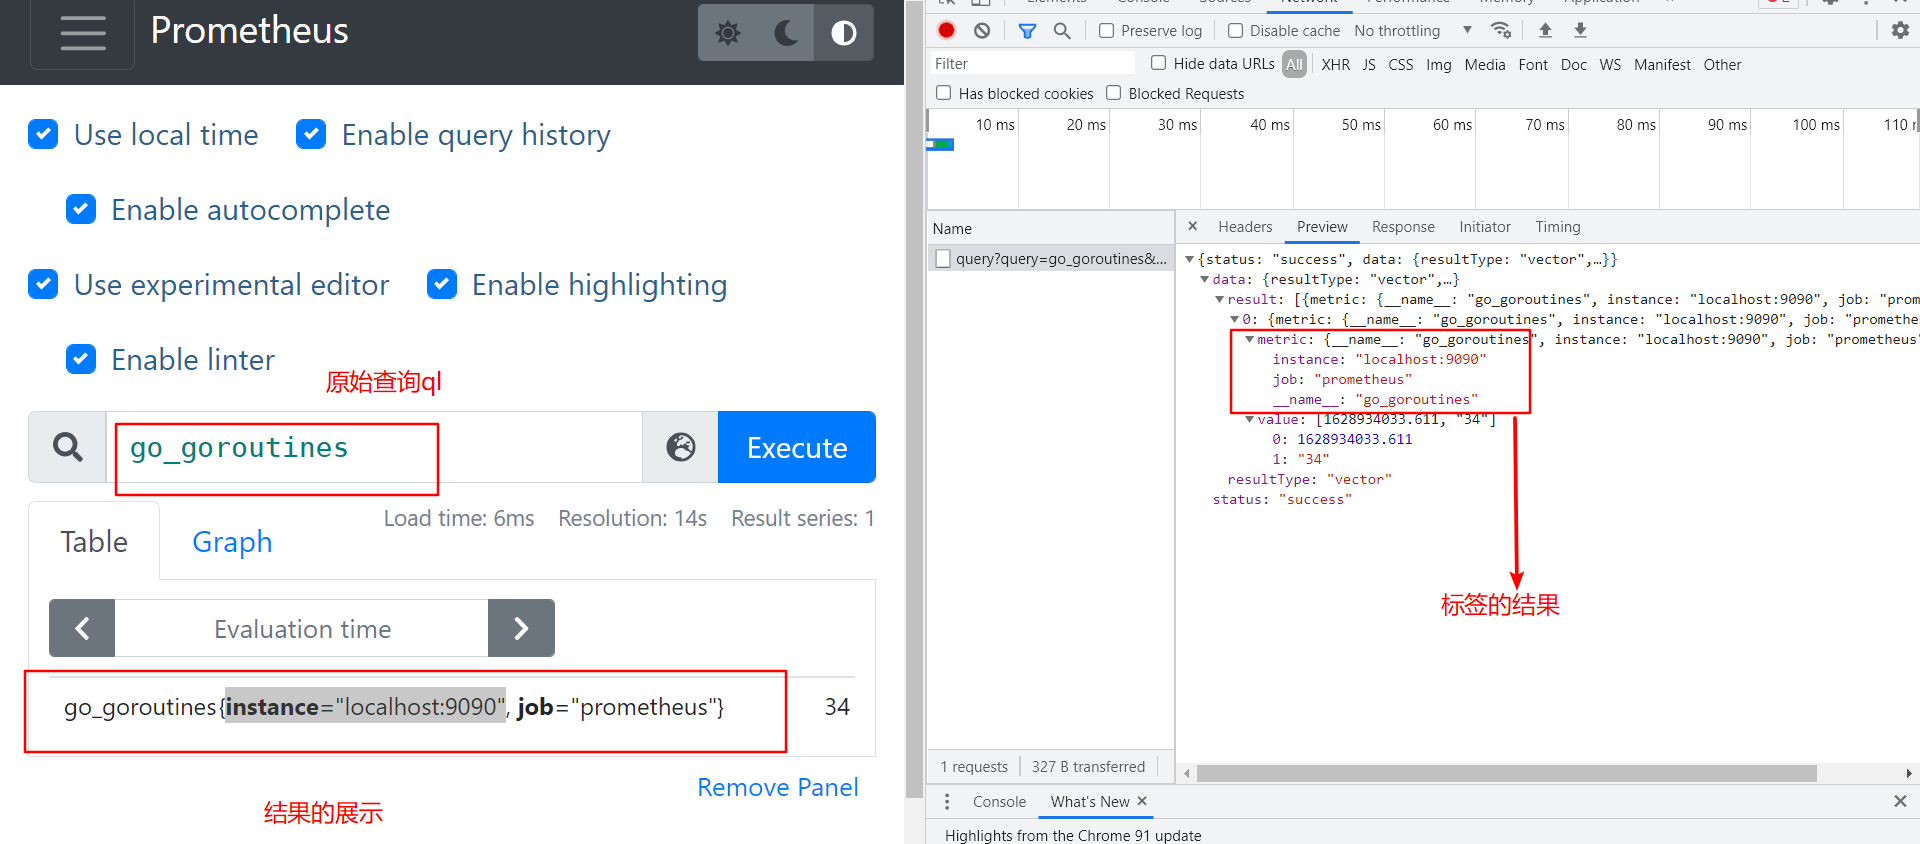
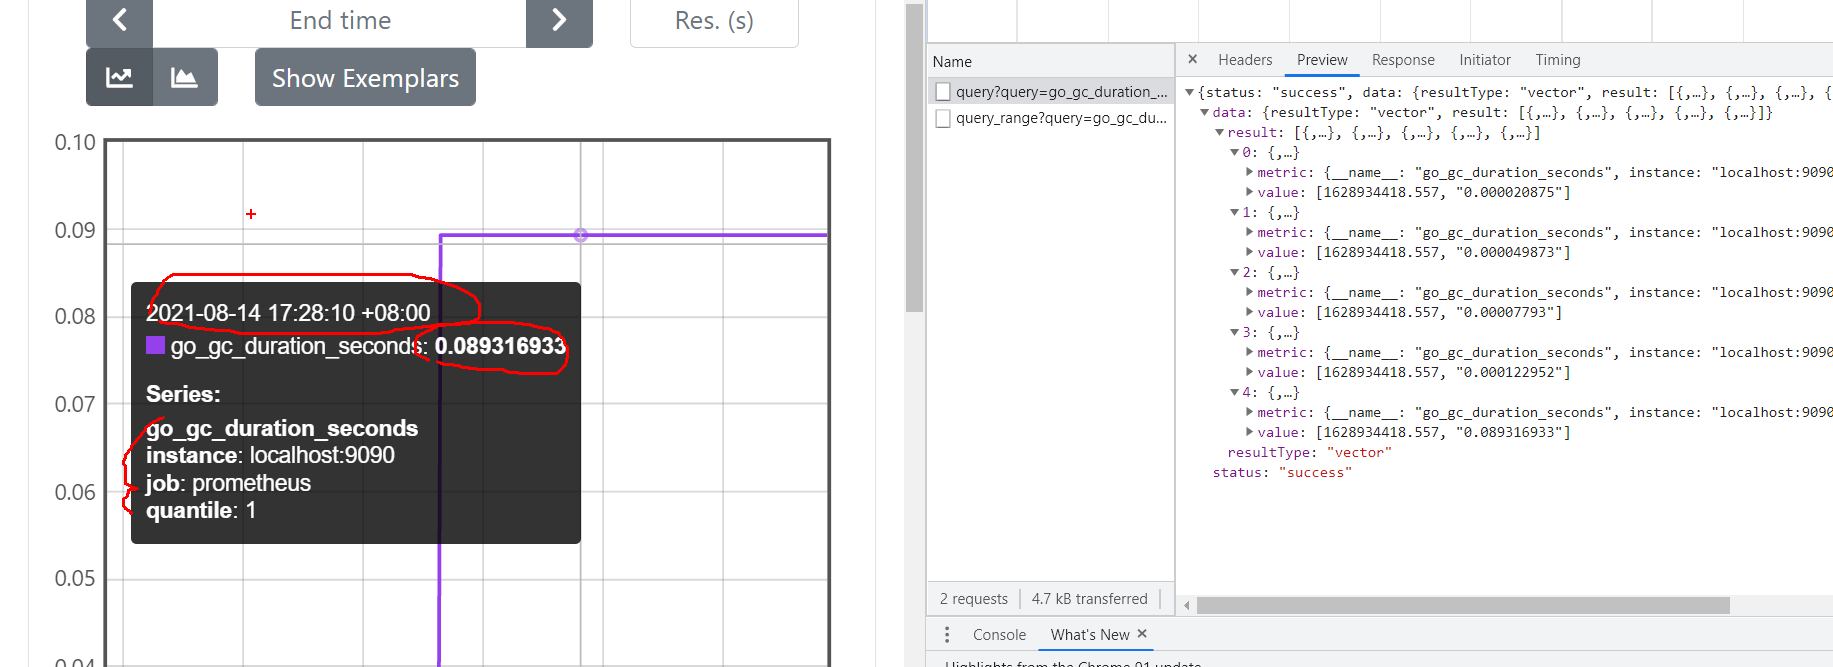
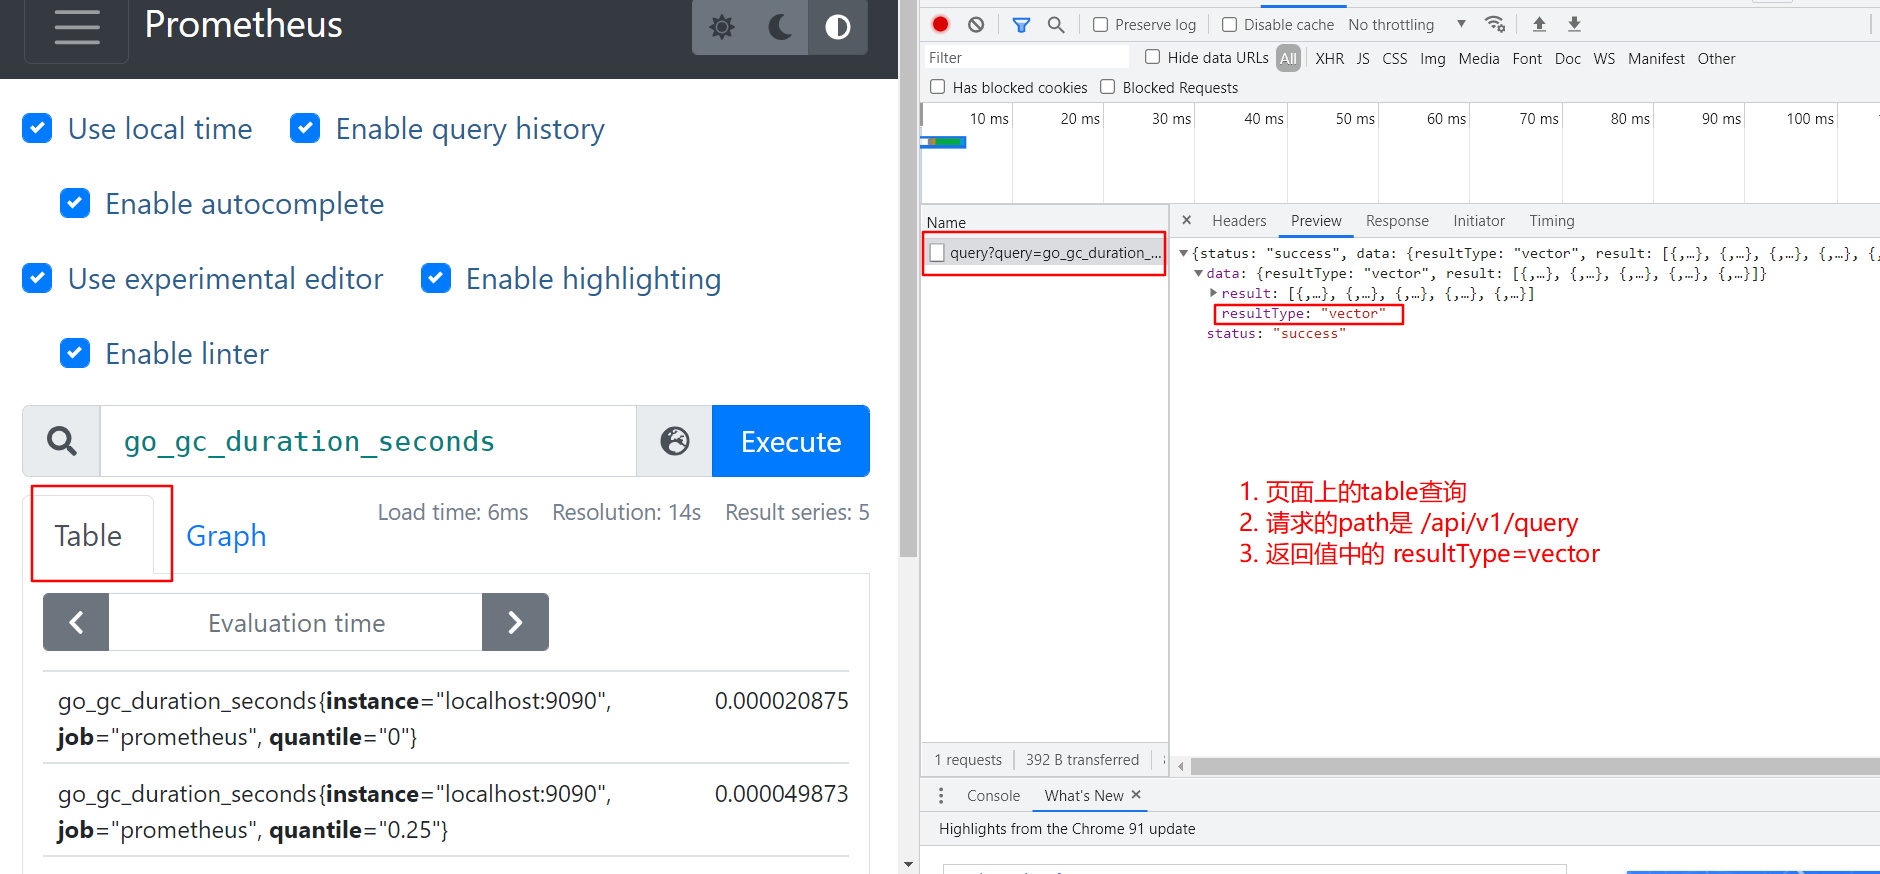
即时向量 Instant vector : 一组时间序列,每个时间序列包含一个样本,所有样本共享相同的时间戳
- vector 向量 源码位置 D:\nyy_work\go_path\src\github.com\prometheus\prometheus\promql\value.go
// Vector is basically only an alias for model.Samples, but the
// contract is that in a Vector, all Samples have the same timestamp.
type Vector []Sample
- vector 向量,是samples的别名,但是所有sample具有相同timestamp ,常用作instant_query的结果
- 在prometheus页面上就是table查询 ,对应查询接口 /api/v1/query
- 举例图片
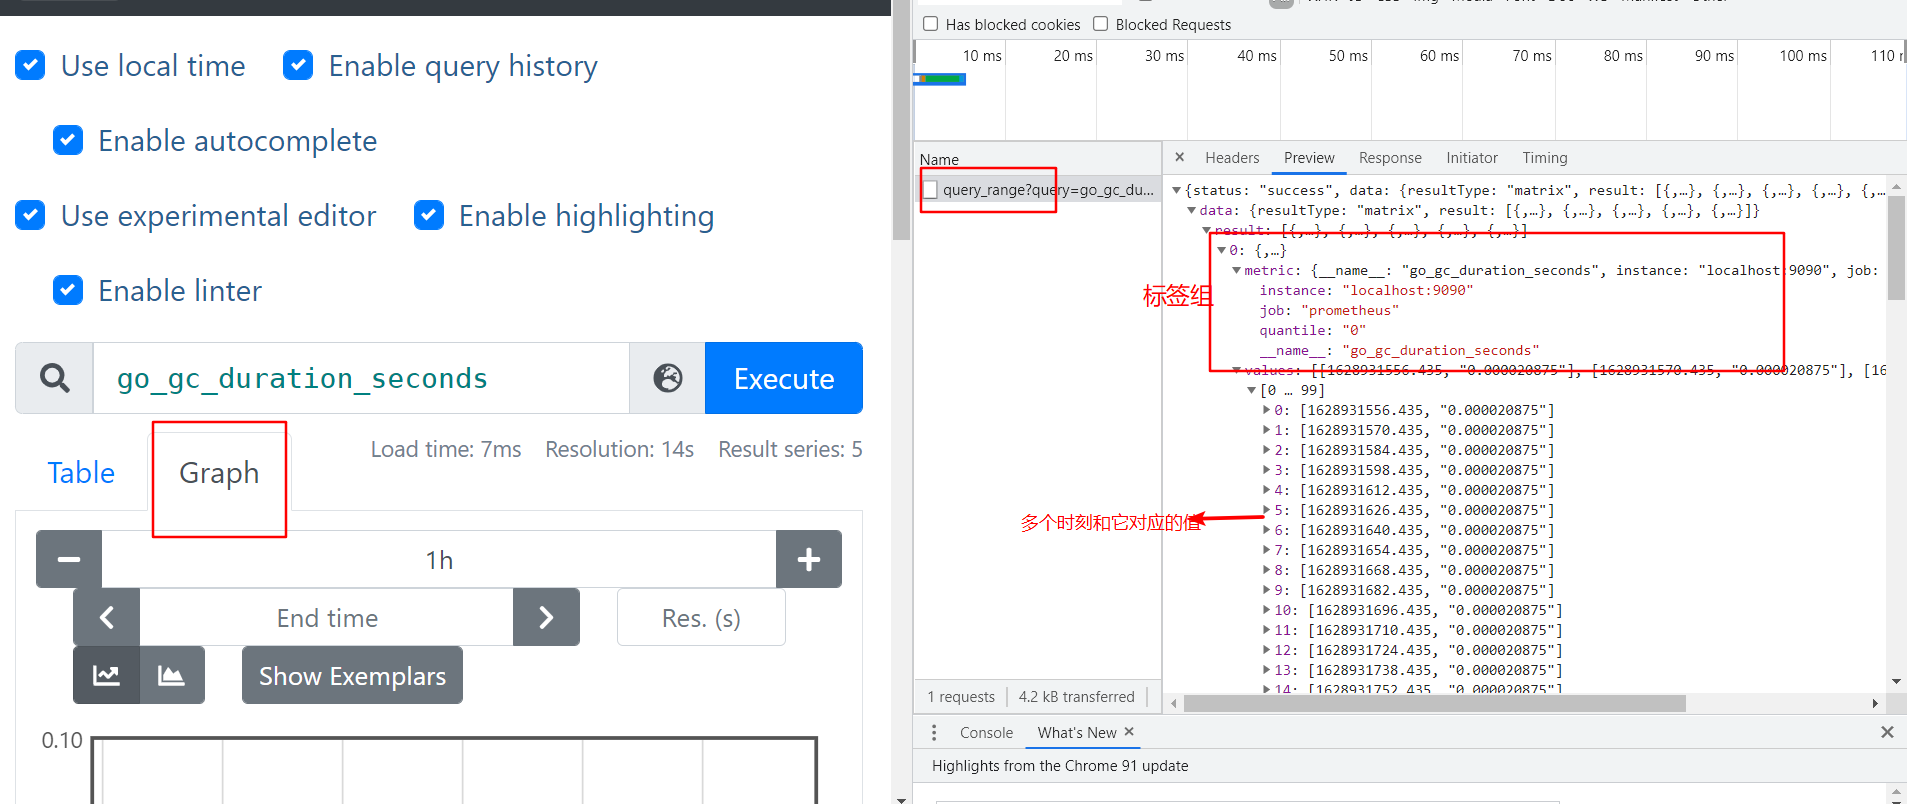
范围向量 Range vector : 一组时间序列,一段时间的结果查询
- 在prometheus页面上就是graph查询 ,对应查询接口 /api/v1/query_range
- 返回的结果是Matrix 矩阵
- 源码位置 D:\nyy_work\go_path\src\github.com\prometheus\prometheus\promql\value.go
// Matrix is a slice of Series that implements sort.Interface and
// has a String method.
type Matrix []Series
- **Matrix是series的切片 **
- Series源码位置 D:\nyy_work\go_path\src\github.com\prometheus\prometheus\promql\value.go
// Series is a stream of data points belonging to a metric.
type Series struct {
	Metric labels.Labels `json:"metric"`
	Points []Point       `json:"values"`
}
- series 是标签组+Points的组合
- 举例图片
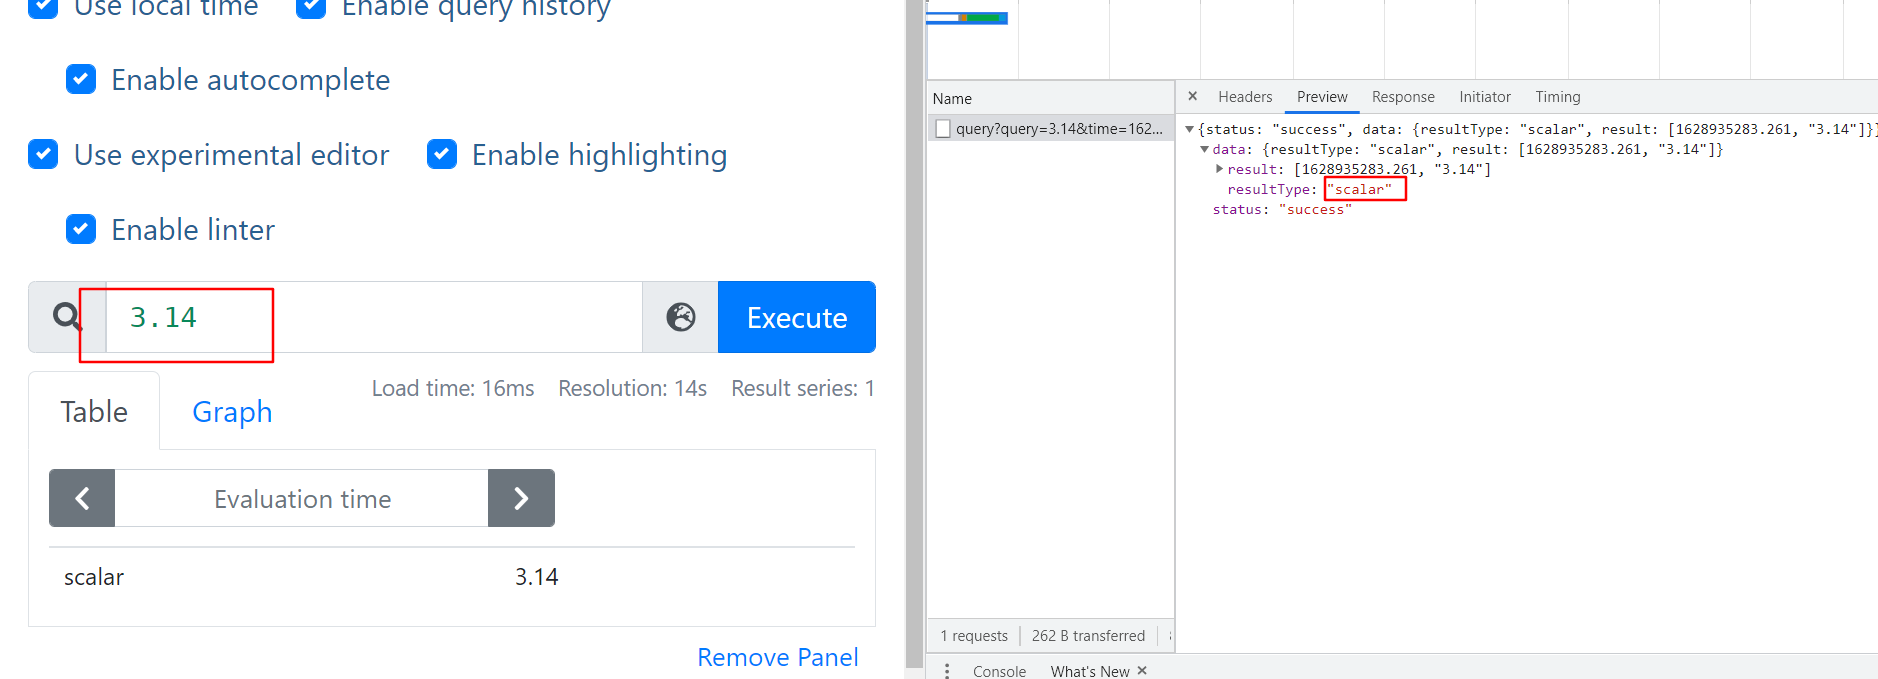
标量 Scalar 一个简单的数字浮点值查询
- 举例图片
String 一个简单的字符串值;目前未使用
四种标签匹配模式
- 4种查询类型
=等于!=不等于=~正则匹配!~正则非匹配
- =,!=不需要正则,速度最快
- 4种可以自由组合
- 标签的key要明确给出
__name__也是个标签,可以匹配metrics- promql中查询没数据,大多是标签匹配的问题
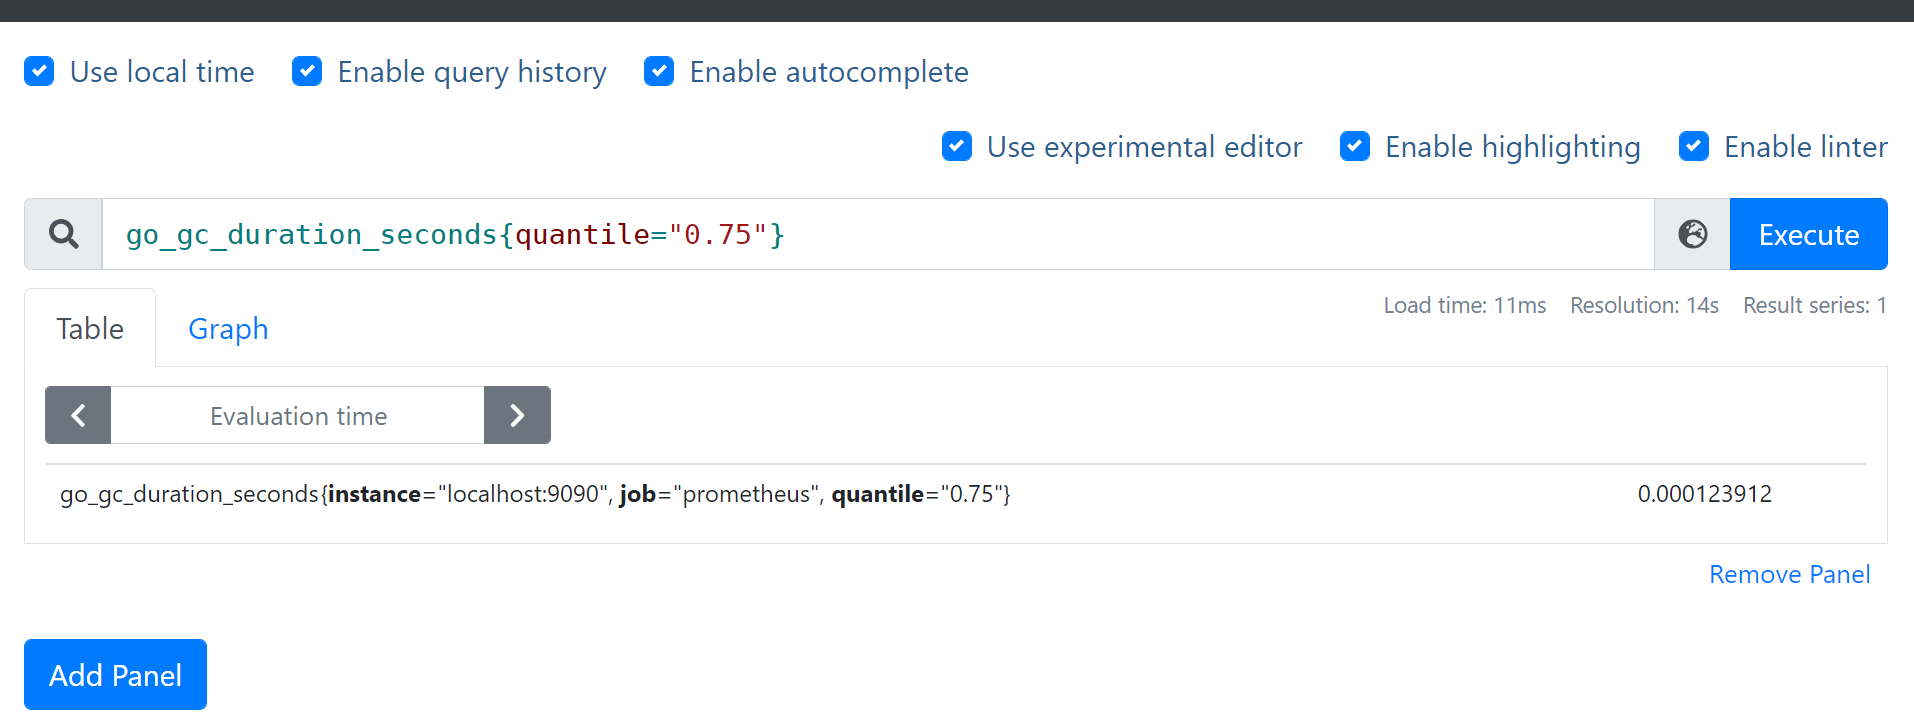
1. = 等于
- 查询举例: cpu第一个核并且是用户态的数据 node_cpu_seconds_total{mode=“user”,cpu=“0”}
- 查询举例: go_gc_duration_seconds{quantile=“0.75”}
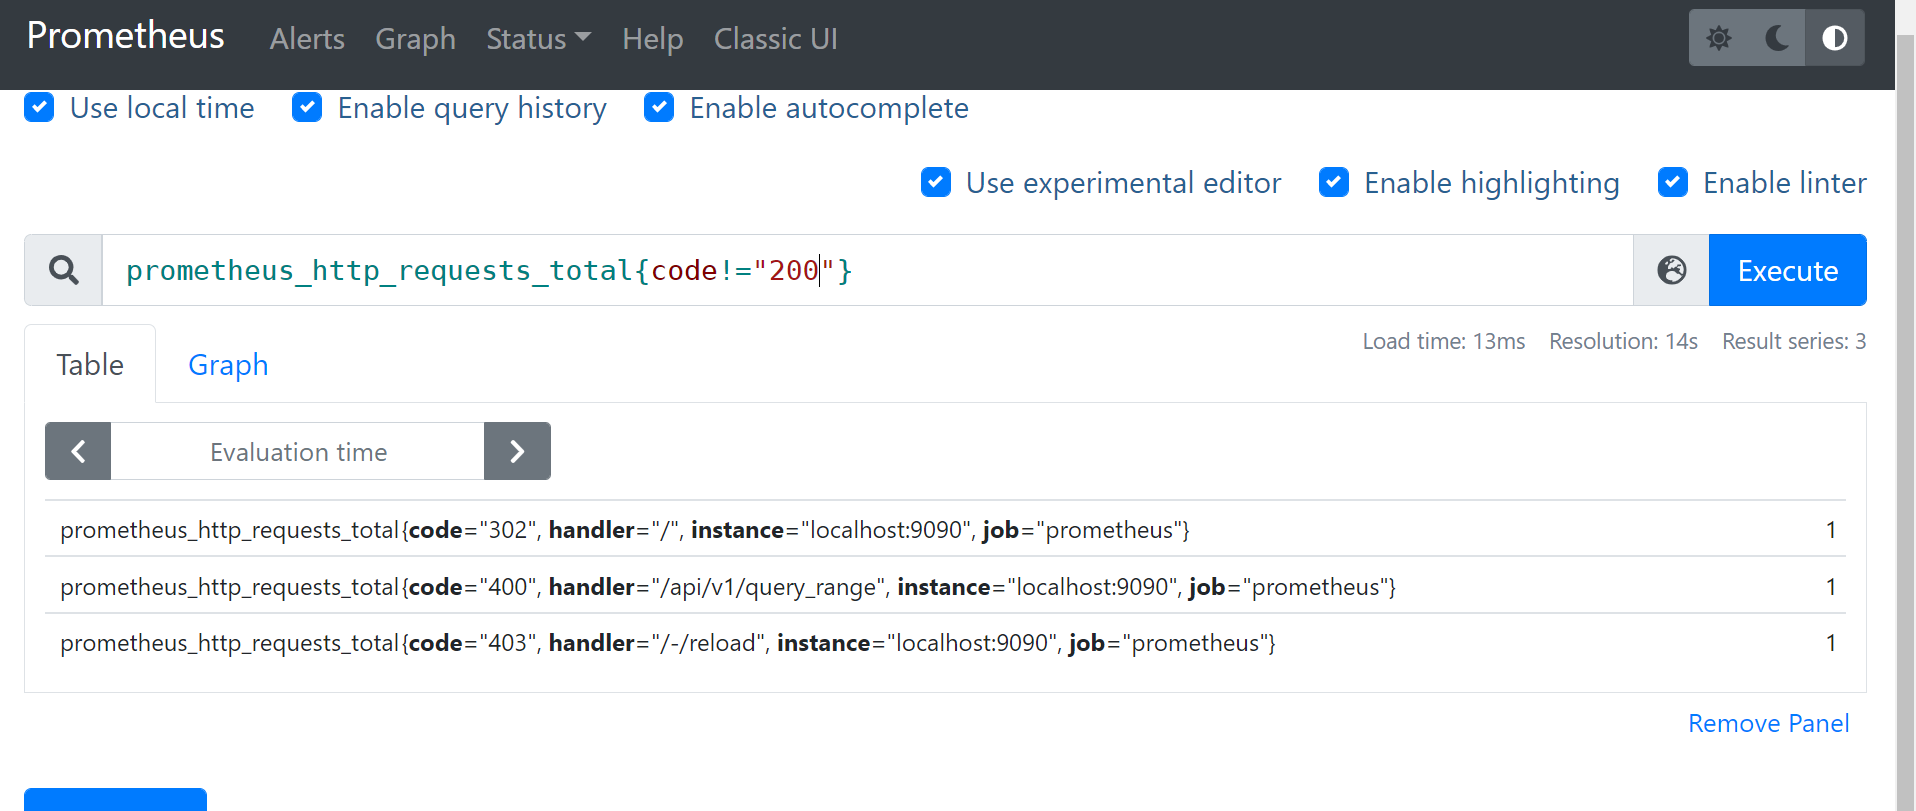
2. != 不等于
- 查询举例: 非lo网卡的接收字节数 node_network_receive_bytes_total{device!=“lo”}
- 查询举例:
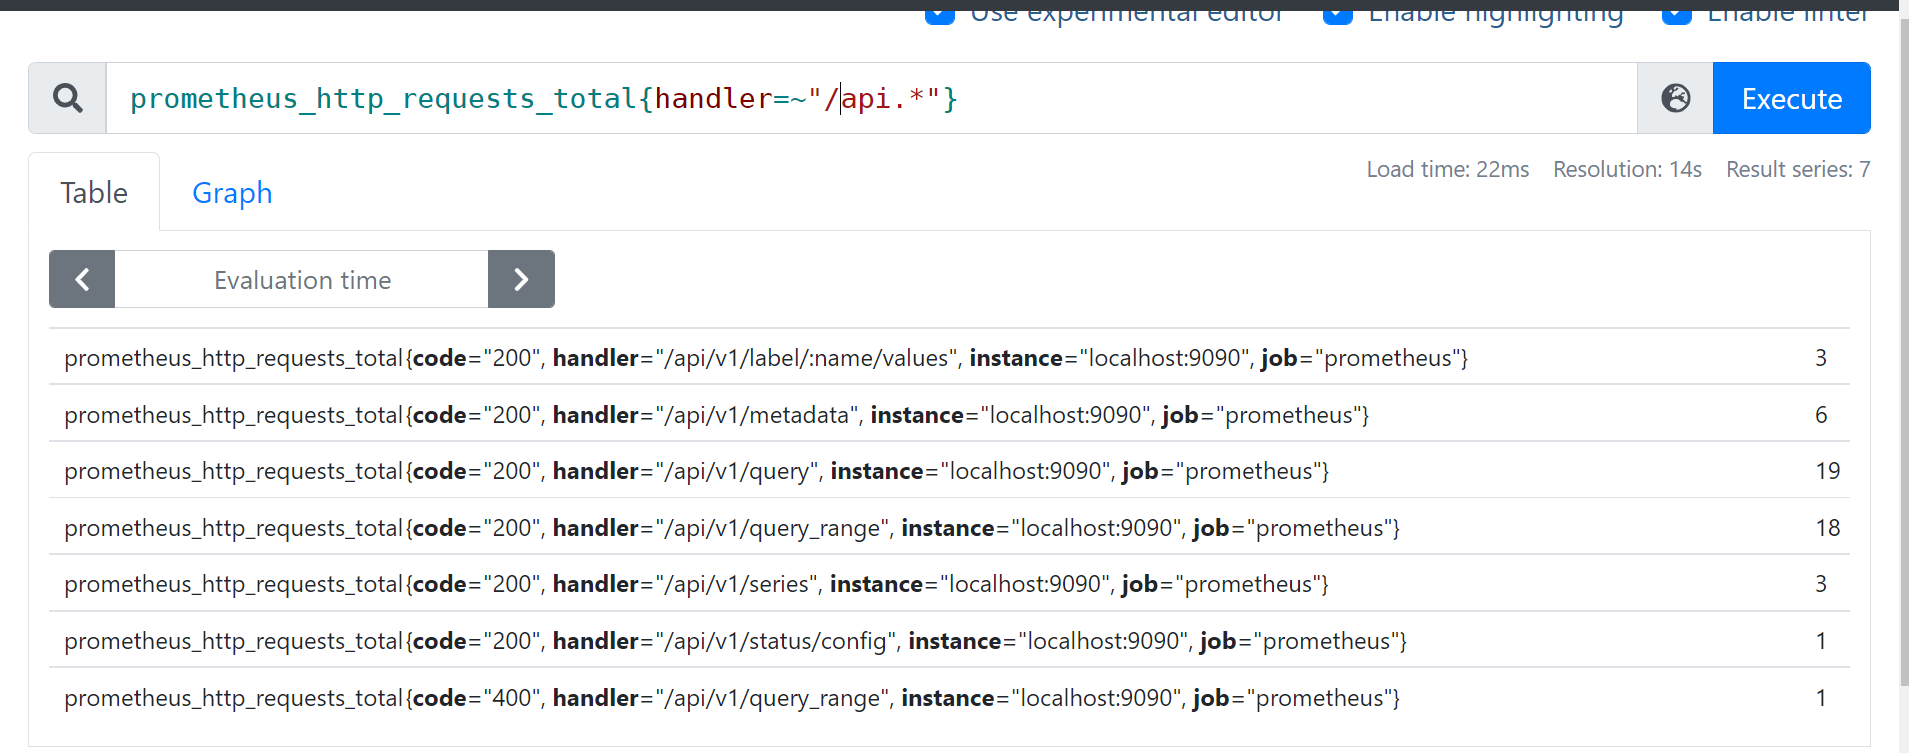
3. =~ 正则匹配
- eg 查询: 挂载点以/run开头的文件系统剩余字节数 node_filesystem_avail_bytes{mountpoint=~“^/run.*”}
- eg 查询: prometheus_http_requests_total{handler=~“/api.*”}
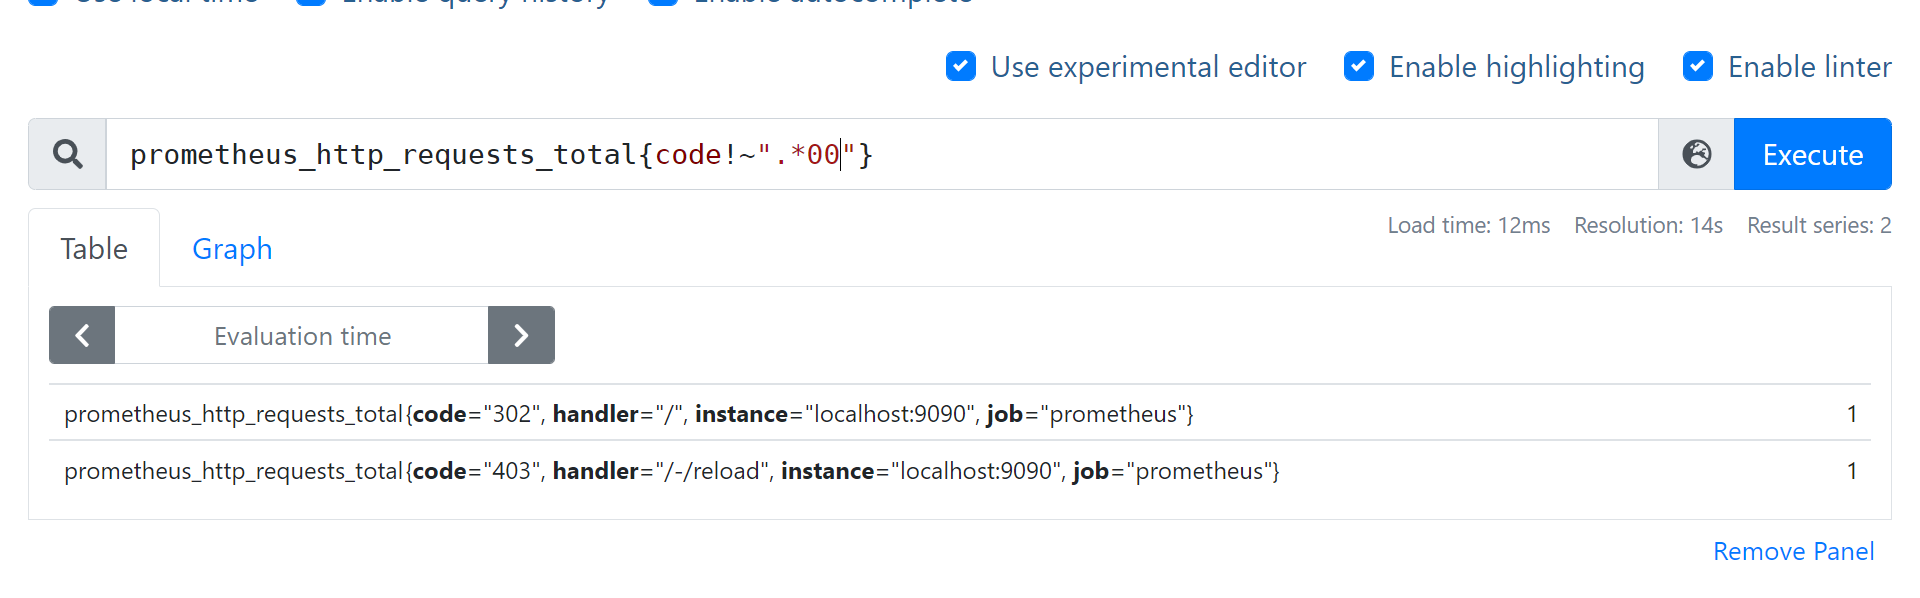
4. !~ 正则非匹配
- 查询: 块设备名字不包含vda的读字节数 node_disk_read_bytes_total{device!~“.vda.”}
- 查询: prometheus_http_requests_total{code!~“.*00”}
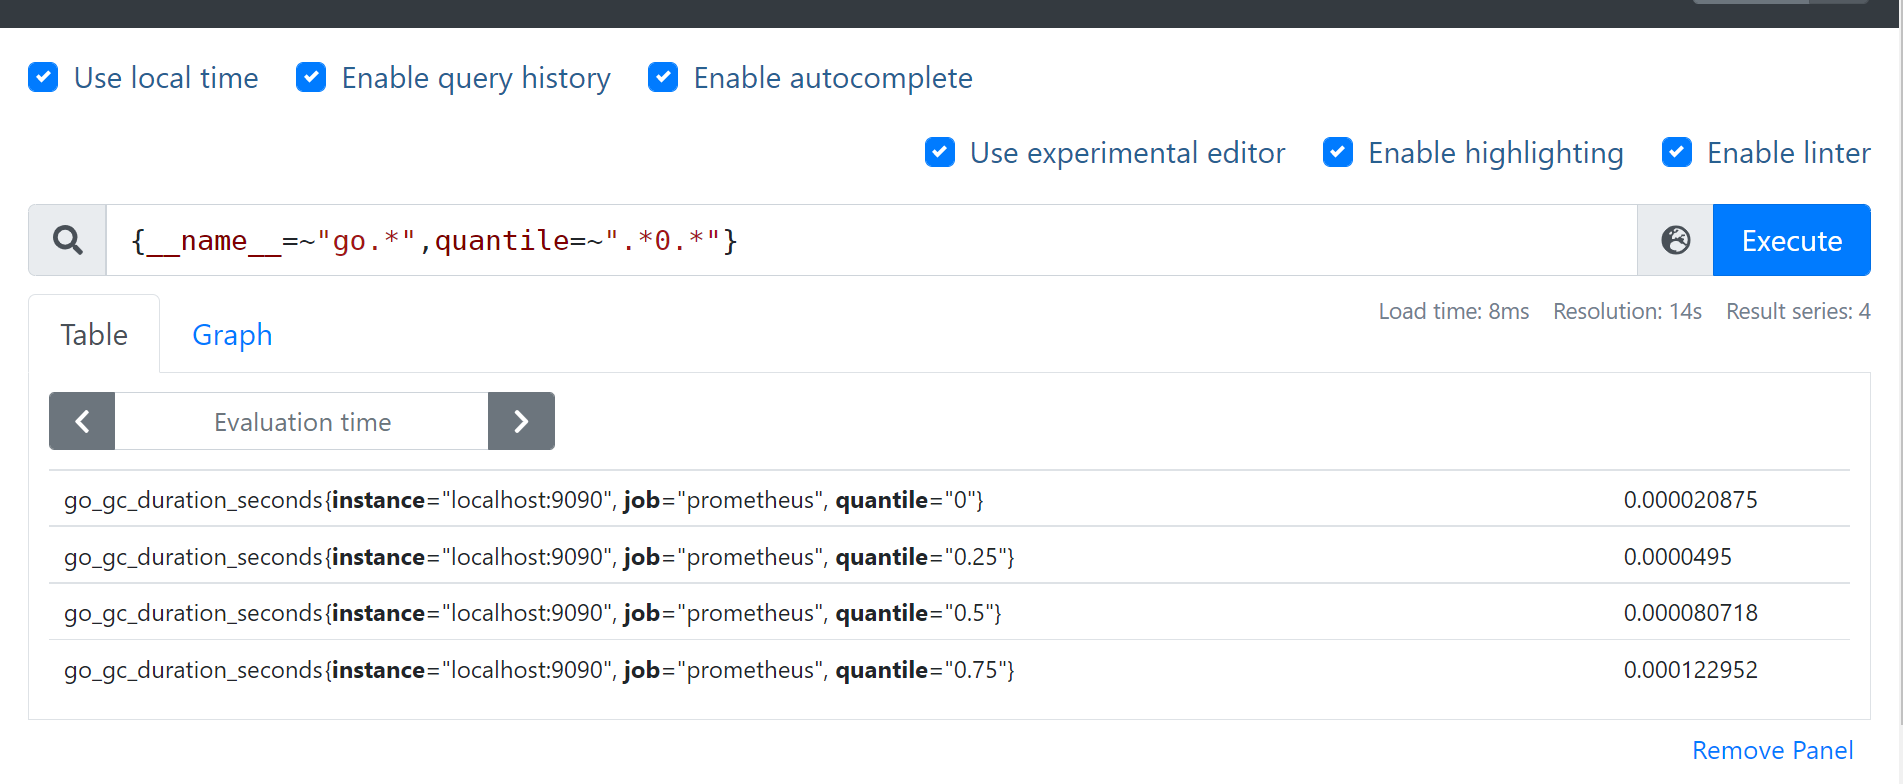
5. __name__ 也是个标签,可以匹配metrics
- 查询 {name=“go.*”,quantile=“.0.”} 等价于 go_gc_duration_seconds{quantile=~“.0.”} (name为go_gc_duration_seconds)
四种数据类型
在Prometheus的存储实现上所有的监控样本都是以time-series的形式保存在Prometheus内存的TSDB(时序数据库)中,而time-series所对应的监控指标(metric)也是通过labelset进行唯一命名的。
为了能够帮助用户理解和区分这些不同监控指标之间的差异,Prometheus定义了4种不同的指标类型(metric type):Counter(计数器)、Gauge(仪表盘)、Histogram(直方图)、Summary(摘要)。
- 四种数据类型
- gauge:可增可减的仪表盘,查看当前值,主要用来看标签的key和value
- counter: 只增不减的计数器,多用在请求计数,cpu统计
- histogram:直方图样本观测,服务端算分位值
- 对每个采样点进行统计(并不是一段时间的统计),打到各个桶(bucket)中
- 对每个采样点值累计和(sum)
- 对采样点的次数累计和(count
- 度量指标名称: [basename]的柱状图, 上面三类的作用度量指标名称
- summary:摘要:客户端算分位值
- 利用 sum/count 算平均值 :histogram 和summary 都适用
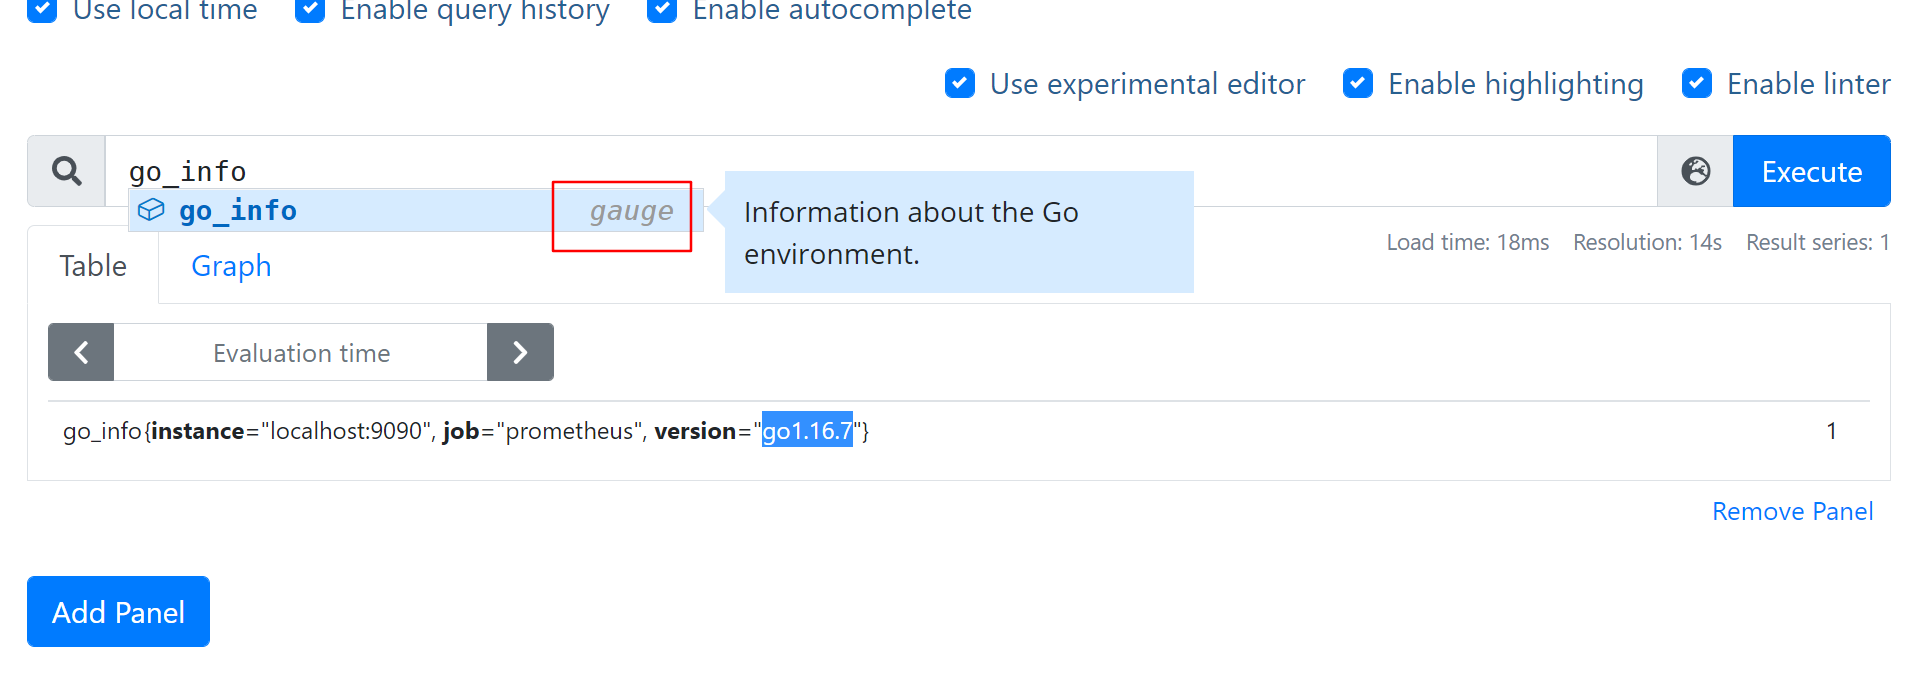
gauge 当前值
- 举例 go_info{instance=“localhost:9090”, job=“prometheus”, version=“go1.16.7”}
- 类似的info信息,看时序的结果值(=1) 意义不大
- 主要是看标签的key和value, go.1.16.7–>go version ,关注一下
- 举例 go_memstats_heap_alloc_bytes
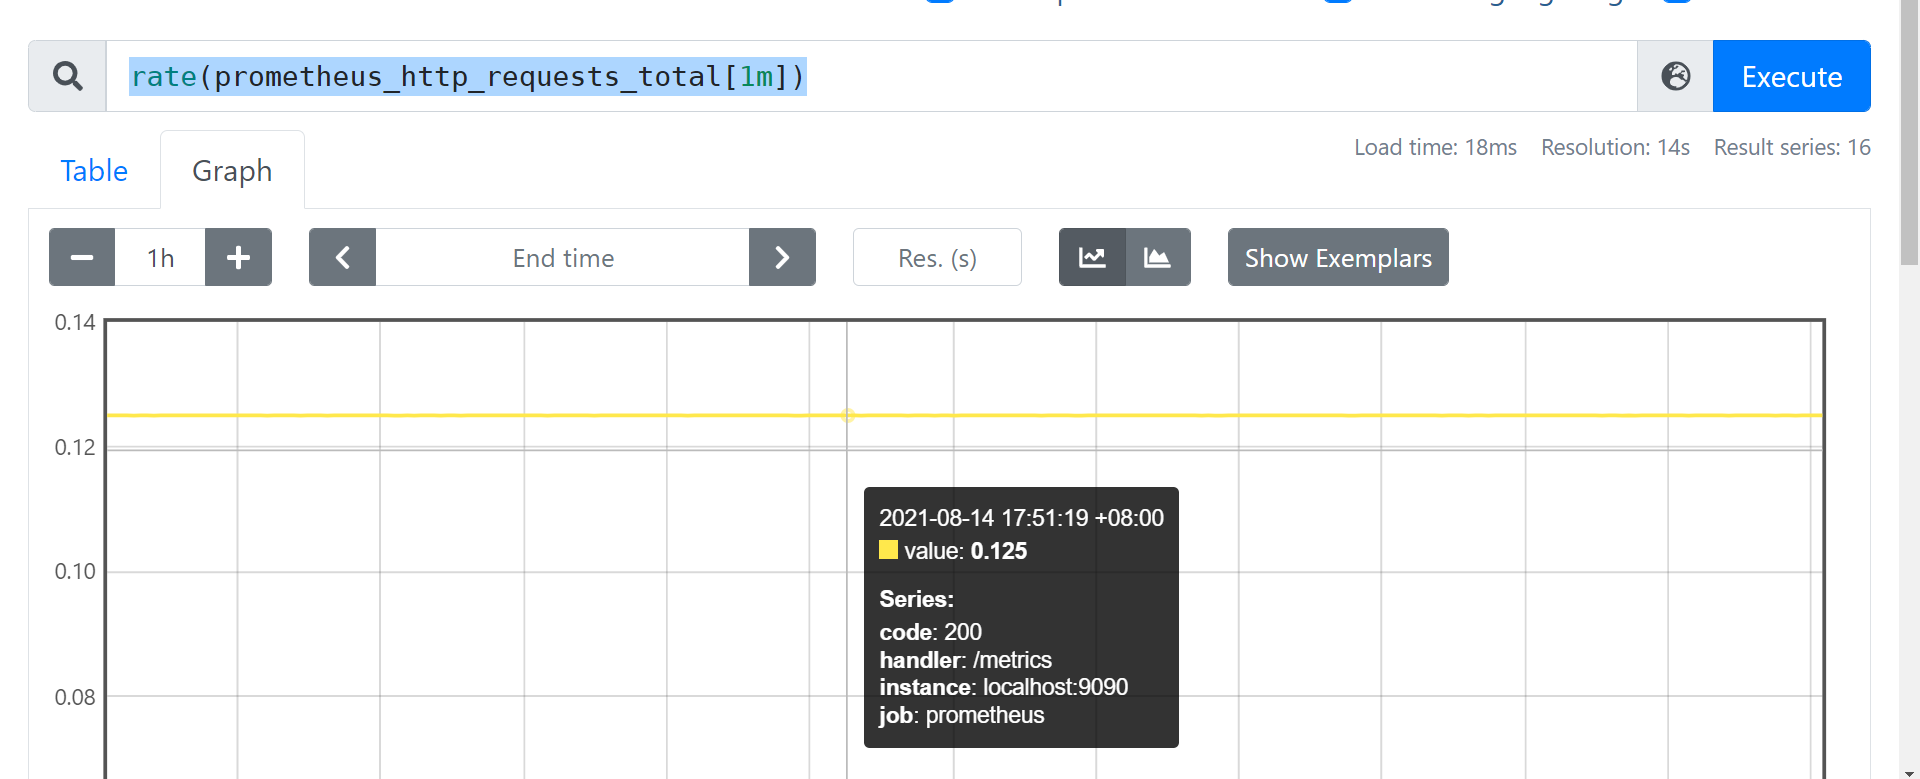
counter 计数器
- 代表一个累积指标单调递增计数器
- 使用rate 查看qps, eg: rate(prometheus_http_requests_total[1m])
- 使用increase 函数查看增量 increase(prometheus_http_requests_total[10s])
histogram 直方图样本观测
- 通常之类的东西请求持续时间或响应大小和计数它们配置的桶中
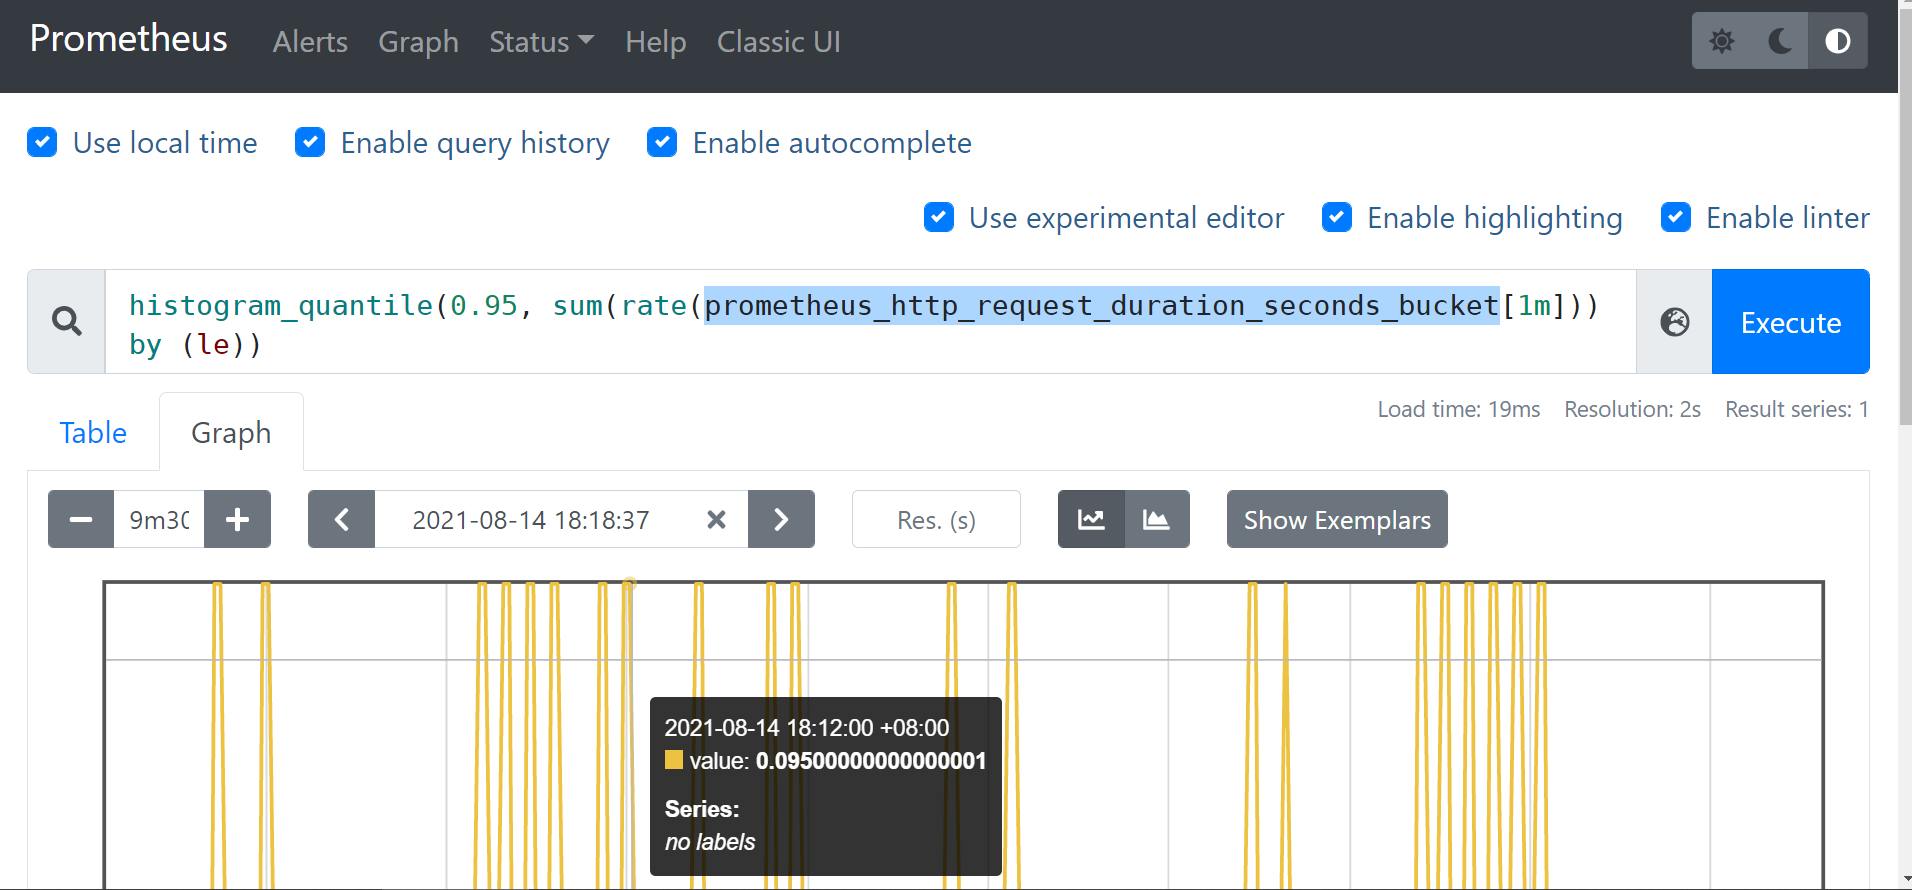
- 它还提供所有观察值的总和
# http所有接口 总的95分位值
# sum/count 可以算平均值
prometheus_http_request_duration_seconds_sum/ prometheus_http_request_duration_seconds_count

# histogram_quantile(0.95, sum(rate(prometheus_http_request_duration_seconds_bucket[5m])) by (le,handler))

histogram_quantile(0.95, sum(rate(prometheus_http_request_duration_seconds_bucket[1m])) by (le))

# range_query接口的95分位值
histogram_quantile(0.95, sum(rate(prometheus_http_request_duration_seconds_bucket{handler="/api/v1/query_range"}[5m])) by (le))
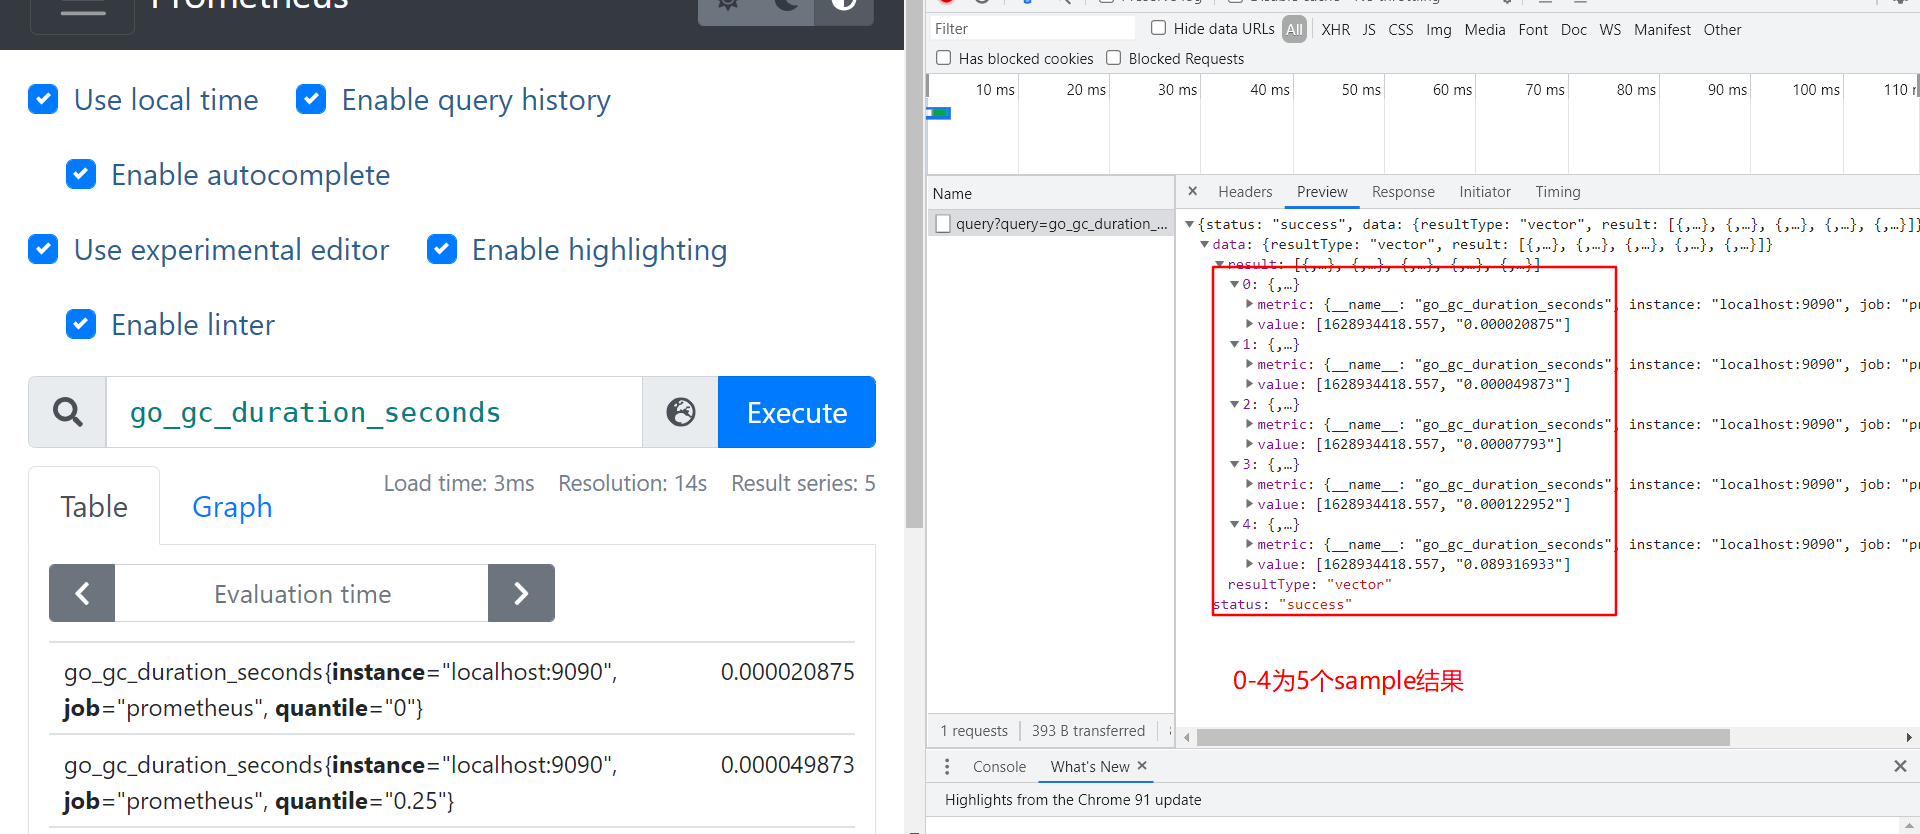
summary 摘要会采样观察值
- 通常是请求持续时间和响应大小之类的东西
- 尽管它还提供了观测值的总数和所有观测值的总和
# gc耗时

# HELP go_gc_duration_seconds A summary of the pause duration of garbage collection cycles.
# TYPE go_gc_duration_seconds summary
go_gc_duration_seconds{quantile="0"} 0.000135743
go_gc_duration_seconds{quantile="0.25"} 0.000872805
go_gc_duration_seconds{quantile="0.5"} 0.000965516
go_gc_duration_seconds{quantile="0.75"} 0.001055636
go_gc_duration_seconds{quantile="1"} 0.006464756

# summary 平均值
go_gc_duration_seconds_sum /go_gc_duration_seconds_count
利用 sum/count 算平均值 :histogram 和summary 都适用
- go_gc_duration_seconds_sum/go_gc_duration_seconds_count 算平均值
时间范围选择器
范围向量选择器 Range Vector Selectors
- 范围矢量的工作方式与即时矢量一样,不同之处在于它们从当前即时中选择了一定范围的样本。语法上,将持续时间附加在[]向量选择器末尾的方括号()中,以指定应为每个结果范围向量元素提取多远的时间值。
- 只能作用在
counter上
时间范围
ms -毫秒
s -秒
m - 分钟
h - 小时
d -天-假设一天总是24小时
w -周-假设一周始终为7天
y -年-假设一年始终为365天
- 时间范围不能脱离rate等函数,不然会报错
eg:直接查询报错 promhttp_metric_handler_requests_total[1m]
Error executing query: invalid expression type "range vector" for range query, must be Scalar or instant Vector
需要叠加一个非聚合函数 如 rate irate delta idelta sum 等
- 计算网卡入流量
rate(promhttp_metric_handler_requests_total[1m])
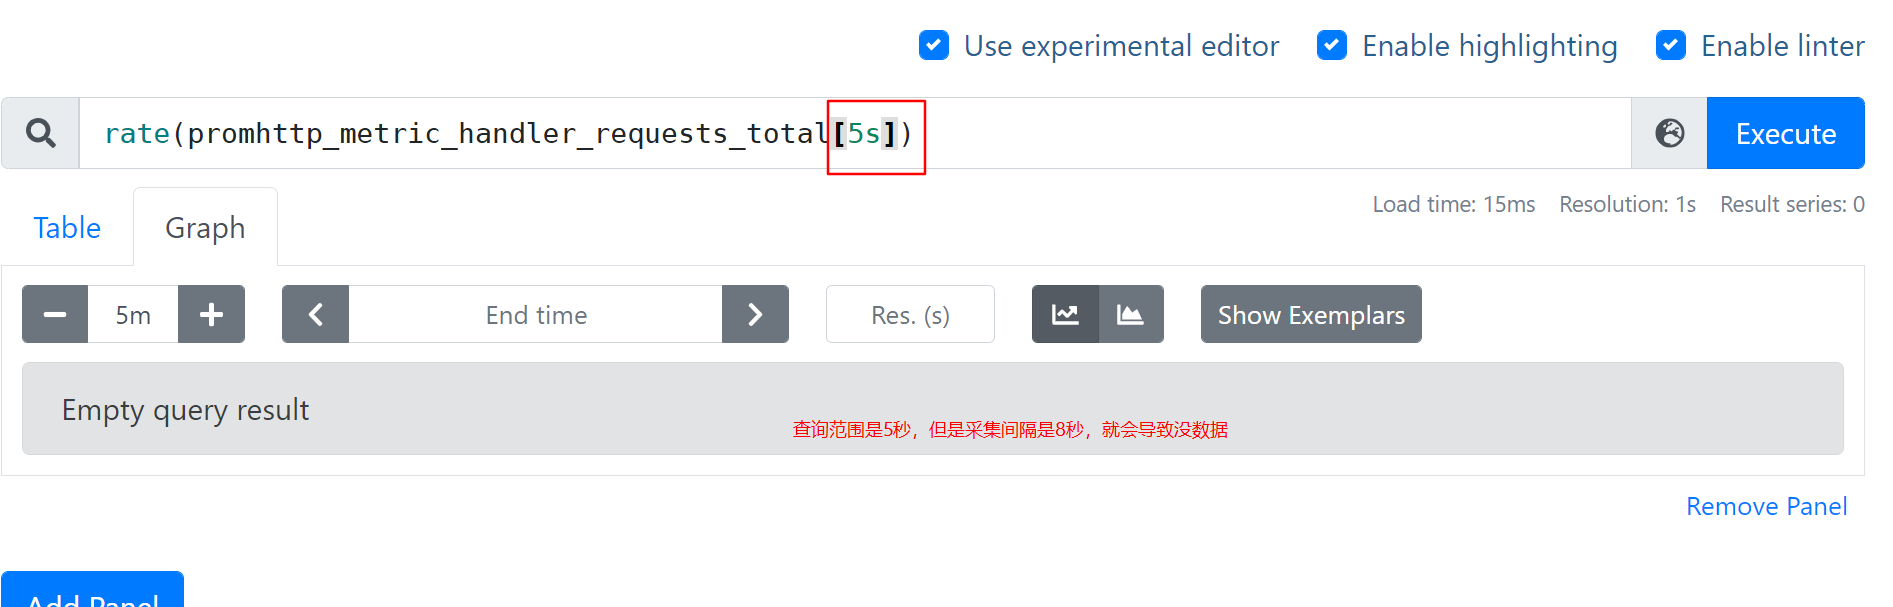
时间范围不能低于采集间隔
- 采集8秒 ,查询3秒则无数据
- rate(promhttp_metric_handler_requests_total[3s])
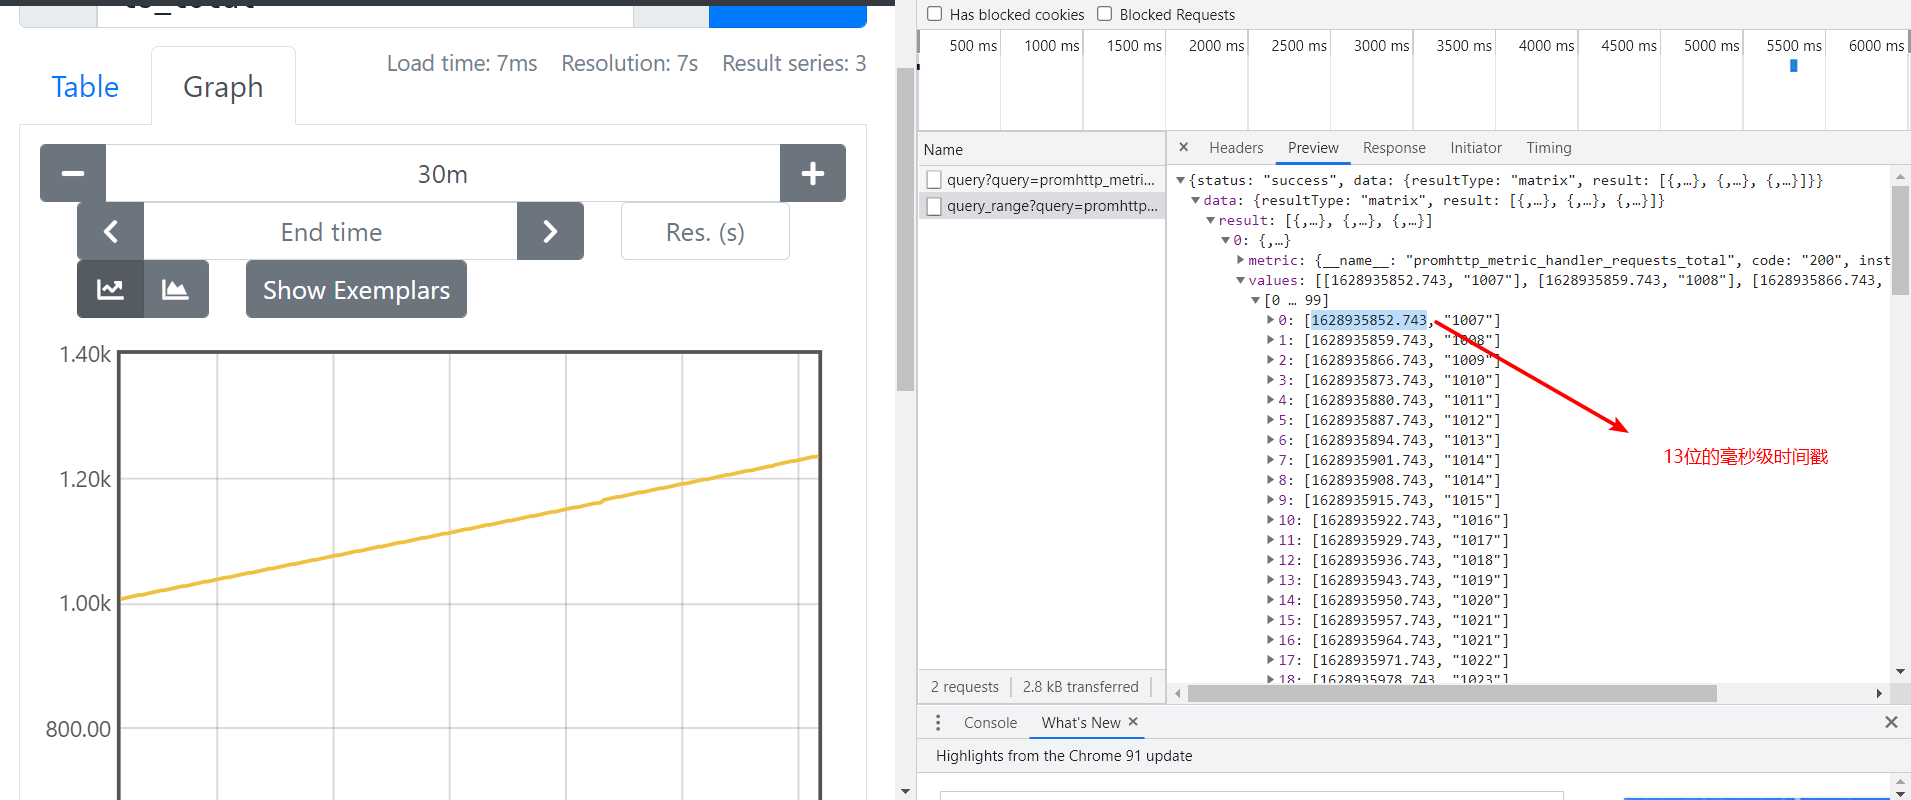
prometheus返回的都是毫秒时间戳
- 10位代表秒时间戳
- 13位代表毫秒时间戳
- 举例图片
实用功能总结
- topk:返回最值
- absent nodata:报警
- 分位值展示:histogram_quantile
- offset:同环比
- 成功的/总的 = 成功率
- agg_over_time:横向的聚合
查询函数文档
举例
agg 去掉/保留 label ,分布情况
- 去掉举例:
sum without(code) (rate(prometheus_http_requests_total[2m] ) ) 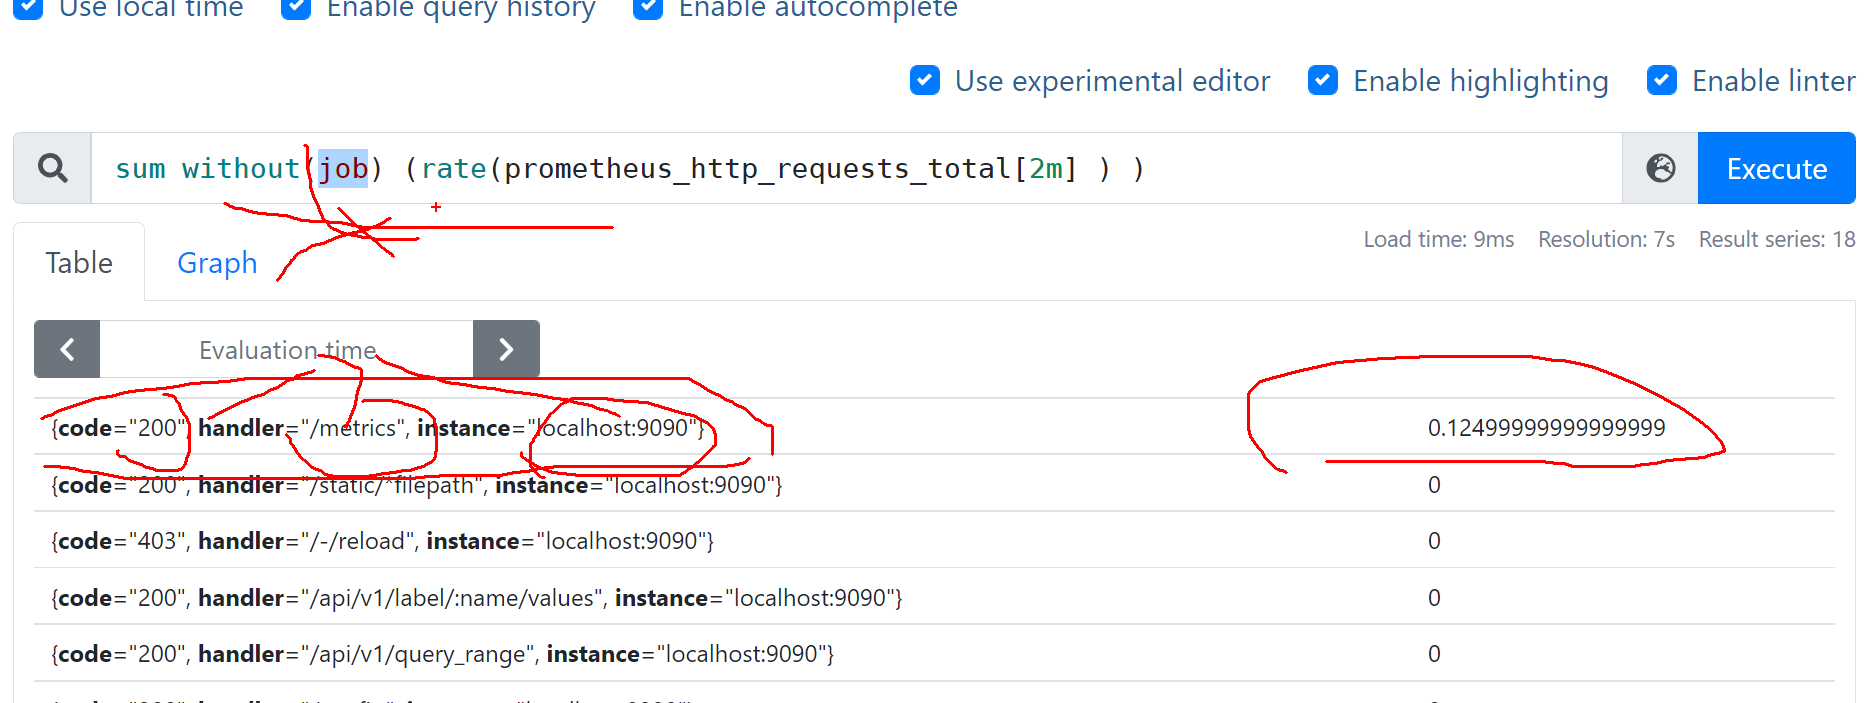
- 保留举例:
sum by(code) (rate(prometheus_http_requests_total[2m] ) ) 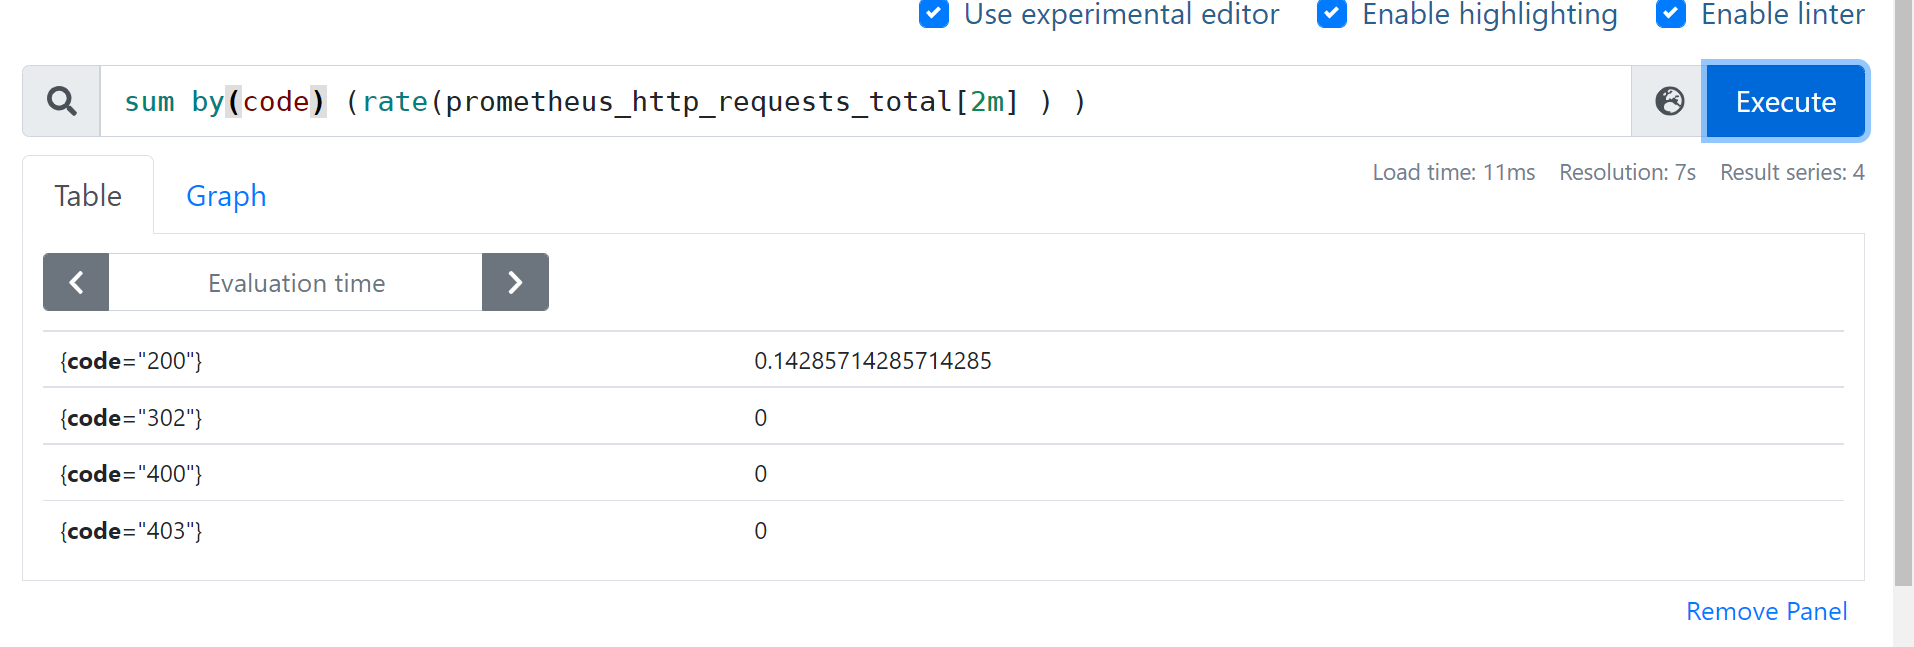
topk bottomK 看top
返回k个最值
- 举例:查看容器cpu使用率top5
topk(5,prometheus_http_response_size_bytes_bucket) 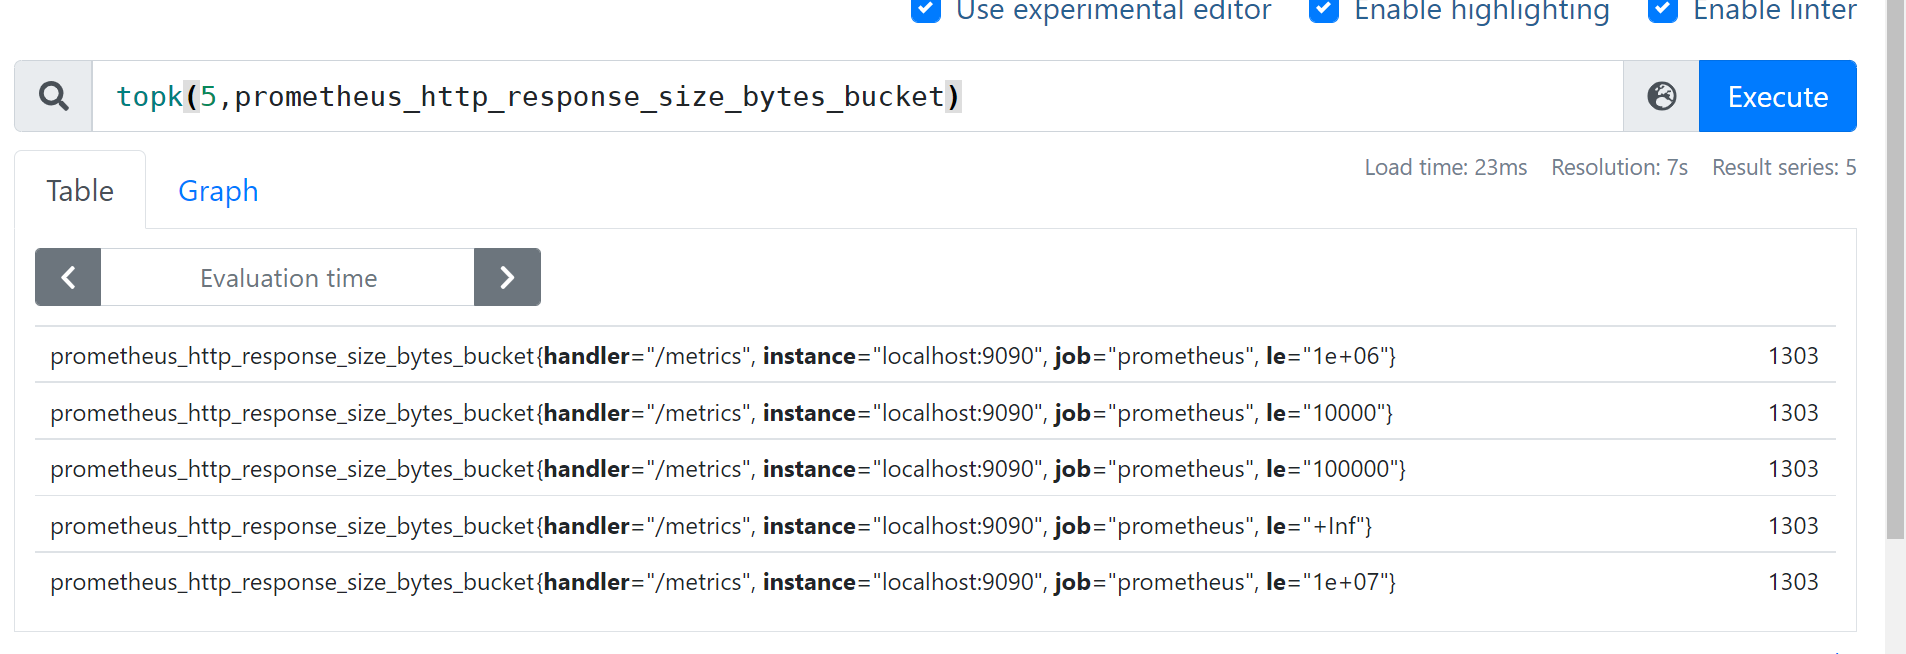
- 最小的 bottomk(5,prometheus_http_response_size_bytes_bucket)
同环比 相减
查询
- 举例:qps环比1小时 减10
sum (rate(prometheus_http_requests_total[2m] offset 1h) ) - sum (rate(prometheus_http_requests_total[2m] ) )
absent nodata报警
- ==1代表absent生效
- 举例:
absent(abc_def)==1
分位值histogram_quantile
- 举例查看apiserver 请求延迟90分位
histogram_quantile(0.90, sum(rate(prometheus_http_request_duration_seconds_bucket[5m])) by (le))
两组series关联 成功率百分比
- 举例:apiserver 请求成功率
100* ( sum(prometheus_http_requests_total{code=~"2.*|3.*"})/ sum(prometheus_http_requests_total) ) 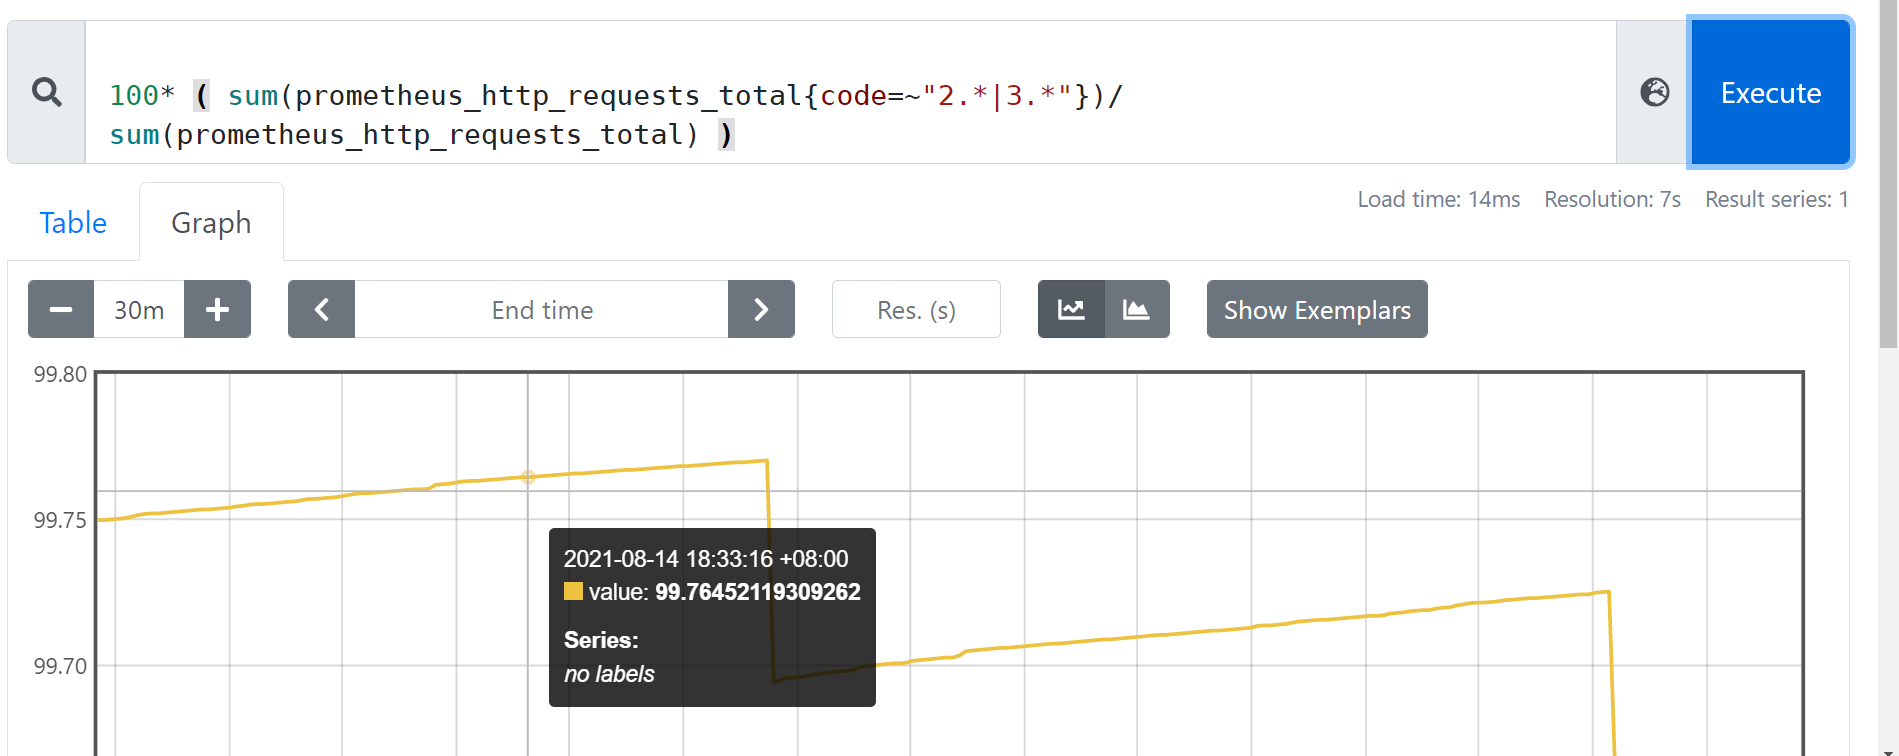
agg_over_time 给所有ts的value做agg横向聚合
- 举例查看一天的alert
avg_over_time(go_goroutines [24h])
Exporter
Exporter是一个采集监控数据,并且通过Prometheus监控规范对外提供数据的组件。
Node Exporter
- 黑白名单的配置方法 --collector.
<name>--no-collector.<name> - 为何会有默认开始的默认关闭的采集模块
- 想做成模块化,只开启用户传入的模块
- 有些不能默认开启,因为很重,很慢
黑白名单配置
项目地址
查看启动日志
Mar 29 15:38:51 prome_master_01 node_exporter: level=info ts=2021-03-29T07:38:51.315Z caller=node_exporter.go:178 msg="Starting node_exporter" version="(version=1.1.2, branch=HEAD, revision=b597c1244d7bef49e6f3359c87a56dd7707f6719)"
Mar 29 15:38:51 prome_master_01 node_exporter: level=info ts=2021-03-29T07:38:51.315Z caller=node_exporter.go:179 msg="Build context" build_context="(go=go1.15.8, user=root@f07de8ca602a, date=20210305-09:29:10)"
Mar 29 15:38:51 prome_master_01 node_exporter: level=warn ts=2021-03-29T07:38:51.315Z caller=node_exporter.go:181 msg="Node Exporter is running as root user. This exporter is designed to run as unpriviledged user, root is not required."
Mar 29 15:38:51 prome_master_01 node_exporter: level=info ts=2021-03-29T07:38:51.316Z caller=filesystem_common.go:74 collector=filesystem msg="Parsed flag --collector.filesystem.ignored-mount-points" flag=^/(dev|proc|sys|var/lib/docker/.+)($|/)
Mar 29 15:38:51 prome_master_01 node_exporter: level=info ts=2021-03-29T07:38:51.316Z caller=filesystem_common.go:76 collector=filesystem msg="Parsed flag --collector.filesystem.ignored-fs-types" flag=^(autofs|binfmt_misc|bpf|cgroup2?|configfs|debugfs|devpts|devtmpfs|fusectl|hugetlbfs|iso9660|mqueue|nsfs|overlay|proc|procfs|pstore|rpc_pipefs|securityfs|selinuxfs|squashfs|sysfs|tracefs)$
Mar 29 15:38:51 prome_master_01 node_exporter: level=info ts=2021-03-29T07:38:51.316Z caller=node_exporter.go:106 msg="Enabled collectors"
Mar 29 15:38:51 prome_master_01 node_exporter: level=info ts=2021-03-29T07:38:51.316Z caller=node_exporter.go:113 collector=arp
Mar 29 15:38:51 prome_master_01 node_exporter: level=info ts=2021-03-29T07:38:51.316Z caller=node_exporter.go:113 collector=bcache
Mar 29 15:38:51 prome_master_01 node_exporter: level=info ts=2021-03-29T07:38:51.316Z caller=node_exporter.go:113 collector=bonding
Mar 29 15:38:51 prome_master_01 node_exporter: level=info ts=2021-03-29T07:38:51.316Z caller=node_exporter.go:113 collector=btrfs
Mar 29 15:38:51 prome_master_01 node_exporter: level=info ts=2021-03-29T07:38:51.316Z caller=node_exporter.go:113 collector=conntrack
Mar 29 15:38:51 prome_master_01 node_exporter: level=info ts=2021-03-29T07:38:51.316Z caller=node_exporter.go:113 collector=cpu
Mar 29 15:38:51 prome_master_01 node_exporter: level=info ts=2021-03-29T07:38:51.316Z caller=node_exporter.go:113 collector=cpufreq
Mar 29 15:38:51 prome_master_01 node_exporter: level=info ts=2021-03-29T07:38:51.316Z caller=node_exporter.go:113 collector=diskstats
Mar 29 15:38:51 prome_master_01 node_exporter: level=info ts=2021-03-29T07:38:51.316Z caller=node_exporter.go:113 collector=edac
Mar 29 15:38:51 prome_master_01 node_exporter: level=info ts=2021-03-29T07:38:51.316Z caller=node_exporter.go:113 collector=entropy
Mar 29 15:38:51 prome_master_01 node_exporter: level=info ts=2021-03-29T07:38:51.316Z caller=node_exporter.go:113 collector=fibrechannel
Mar 29 15:38:51 prome_master_01 node_exporter: level=info ts=2021-03-29T07:38:51.316Z caller=node_exporter.go:113 collector=filefd
Mar 29 15:38:51 prome_master_01 node_exporter: level=info ts=2021-03-29T07:38:51.316Z caller=node_exporter.go:113 collector=filesystem
Mar 29 15:38:51 prome_master_01 node_exporter: level=info ts=2021-03-29T07:38:51.316Z caller=node_exporter.go:113 collector=hwmon
Mar 29 15:38:51 prome_master_01 node_exporter: level=info ts=2021-03-29T07:38:51.316Z caller=node_exporter.go:113 collector=infiniband
Mar 29 15:38:51 prome_master_01 node_exporter: level=info ts=2021-03-29T07:38:51.316Z caller=node_exporter.go:113 collector=ipvs
本机curl访问数据
[root@prome_master_01 tgzs]# curl  -s  localhost:9100/metrics |grep node_  |head -20
# HELP node_arp_entries ARP entries by device
# TYPE node_arp_entries gauge
node_arp_entries{device="eth0"} 3
# HELP node_boot_time_seconds Node boot time, in unixtime.
# TYPE node_boot_time_seconds gauge
node_boot_time_seconds 1.616987084e+09
# HELP node_context_switches_total Total number of context switches.
# TYPE node_context_switches_total counter
node_context_switches_total 2.105979e+06
# HELP node_cooling_device_cur_state Current throttle state of the cooling device
# TYPE node_cooling_device_cur_state gauge
node_cooling_device_cur_state{name="0",type="Processor"} 0
node_cooling_device_cur_state{name="1",type="Processor"} 0
node_cooling_device_cur_state{name="2",type="Processor"} 0
node_cooling_device_cur_state{name="3",type="Processor"} 0
# HELP node_cooling_device_max_state Maximum throttle state of the cooling device
# TYPE node_cooling_device_max_state gauge
node_cooling_device_max_state{name="0",type="Processor"} 0
node_cooling_device_max_state{name="1",type="Processor"} 0
node_cooling_device_max_state{name="2",type="Processor"} 0
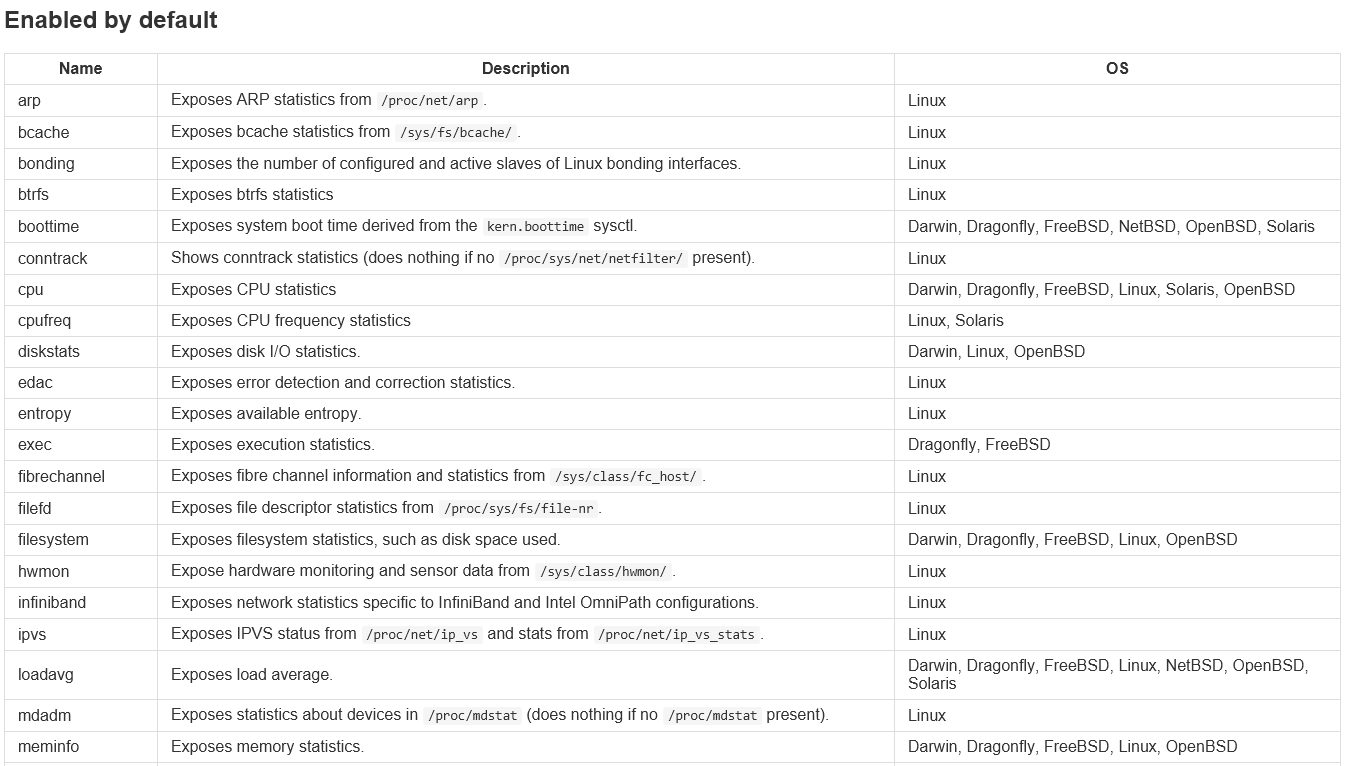
默认开启的采集项目介绍
黑名单: 关闭某一项默认开启的采集项
--no-collector.<name> flag

# 未开启前
[root@prome_master_01 node_exporter]# curl  -s  localhost:9100/metrics |grep node_cpu
# HELP node_cpu_guest_seconds_total Seconds the CPUs spent in guests (VMs) for each mode.
# TYPE node_cpu_guest_seconds_total counter
node_cpu_guest_seconds_total{cpu="0",mode="nice"} 0
node_cpu_guest_seconds_total{cpu="0",mode="user"} 0
node_cpu_guest_seconds_total{cpu="1",mode="nice"} 0
node_cpu_guest_seconds_total{cpu="1",mode="user"} 0
node_cpu_guest_seconds_total{cpu="2",mode="nice"} 0
node_cpu_guest_seconds_total{cpu="2",mode="user"} 0
node_cpu_guest_seconds_total{cpu="3",mode="nice"} 0
node_cpu_guest_seconds_total{cpu="3",mode="user"} 0
# HELP node_cpu_seconds_total Seconds the CPUs spent in each mode.
# TYPE node_cpu_seconds_total counter
node_cpu_seconds_total{cpu="0",mode="idle"} 17691.27
node_cpu_seconds_total{cpu="0",mode="iowait"} 8.9
node_cpu_seconds_total{cpu="0",mode="irq"} 0
node_cpu_seconds_total{cpu="0",mode="nice"} 0.32
node_cpu_seconds_total{cpu="0",mode="softirq"} 0.28
node_cpu_seconds_total{cpu="0",mode="steal"} 2.7
关闭cpu采集
- ./node_exporter --no-collector.cpu
- curl -s localhost:9100/metrics |grep node_cpu
白名单:关闭默认采集项且 只开启某些采集
 --collector.disable-defaults --collector.<name> .

# 只开启mem采集
 ./node_exporter --collector.disable-defaults --collector.meminfo

# 只开启mem 和cpu 采集
./node_exporter --collector.disable-defaults --collector.meminfo --collector.cpu
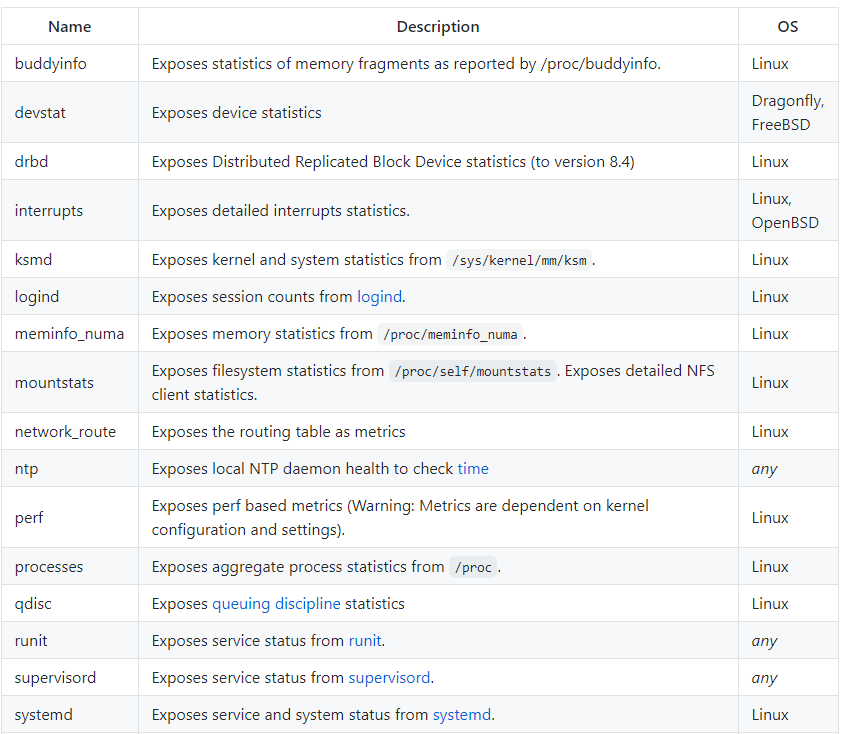
默认关闭的原因
- 太重,需要采集的太多:High cardinality
- 太慢:Prolonged runtime that exceeds the Prometheus scrape_interval or scrape_timeout
- 太多资源开销: Significant resource demands on the host
Node exporter中prometheus sdk指标
promhttp_ 代表访问/metrics 的http情况
[root@prome_master_01 tgzs]# curl  -s  localhost:9100/metrics |grep promhttp_
# HELP promhttp_metric_handler_errors_total Total number of internal errors encountered by the promhttp metric handler.
# TYPE promhttp_metric_handler_errors_total counter
promhttp_metric_handler_errors_total{cause="encoding"} 0
promhttp_metric_handler_errors_total{cause="gathering"} 0
# HELP promhttp_metric_handler_requests_in_flight Current number of scrapes being served.
# TYPE promhttp_metric_handler_requests_in_flight gauge
promhttp_metric_handler_requests_in_flight 1
# HELP promhttp_metric_handler_requests_total Total number of scrapes by HTTP status code.
# TYPE promhttp_metric_handler_requests_total counter
promhttp_metric_handler_requests_total{code="200"} 8
promhttp_metric_handler_requests_total{code="500"} 0
promhttp_metric_handler_requests_total{code="503"} 0
go_开头的代表 goruntime 信息等
# HELP go_goroutines Number of goroutines that currently exist.
# TYPE go_goroutines gauge
go_goroutines 7
# HELP go_info Information about the Go environment.
# TYPE go_info gauge
go_info{version="go1.15.8"} 1
# HELP go_memstats_alloc_bytes Number of bytes allocated and still in use.
# TYPE go_memstats_alloc_bytes gauge
go_memstats_alloc_bytes 2.781752e+06
process_代表 进程信息等
# HELP process_cpu_seconds_total Total user and system CPU time spent in seconds.
# TYPE process_cpu_seconds_total counter
process_cpu_seconds_total 0.54
# HELP process_max_fds Maximum number of open file descriptors.
# TYPE process_max_fds gauge
process_max_fds 1024
# HELP process_open_fds Number of open file descriptors.
# TYPE process_open_fds gauge
process_open_fds 9
# HELP process_resident_memory_bytes Resident memory size in bytes.
# TYPE process_resident_memory_bytes gauge
process_resident_memory_bytes 1.5720448e+07
禁用golang sdk 指标(go_&process_,prom_)
- 使用
--web.disable-exporter-metrics
节点上自打点数据上报
--collector.textfile.directory=""配置本地采集目录- 在采集目录里创建
.prom文件,格式说明
# 创建目录
mkdir ./text_file_dir
# 准备 prom文件
cat <<EOF > ./text_file_dir/test.prom
# HELP nyy_test_metric just test
# TYPE nyy_test_metric gauge
nyy_test_metric{method="post",code="200"} 1027
EOF

# 启动服务
./node_exporter --collector.textfile.directory=./text_file_dir

# curl查看数据
[root@prome_master_01 tgzs]# curl  -s  localhost:9100/metrics |grep nyy
# HELP nyy_test_metric just test
# TYPE nyy_test_metric gauge
nyy_test_metric{code="200",method="post"} 1027
将node_exporter job配置在prometheus中
job的yaml
- job_name: node_exporter
  honor_timestamps: true
  scrape_interval: 8s
  scrape_timeout: 8s
  metrics_path: /metrics
  scheme: http
  follow_redirects: true
  static_configs:
  - targets:
    - 192.168.3.200:9100
编辑prometheus配置文件,发送热更新命令
curl -vvv -X POST localhost:9090/-/reload
在prometheus中查询 node_exporter的指标
支持http传入参数,按采集器过滤指标
使用
- 访问node_exporter metrics页面,传入 collect参数
# 只看cpu采集器的指标
http://192.168.0.112:9100/metrics?collect[]=cpu

# 只看cpu和mem采集器的指标
http://192.168.0.112:9100/metrics?collect[]=cpu&collect[]=meminfo
- prometheus配置参数
  params:
    collect[]:
      - cpu
      - meminfo
- 总的配置变为
- job_name: node_exporter
  honor_timestamps: true
  scrape_interval: 8s
  scrape_timeout: 8s
  metrics_path: /metrics
  scheme: http
  follow_redirects: true
  static_configs:
  - targets:
    - 192.168.3.200:9100
  params:
    collect[]:
      - cpu
      - meminfo
- 和prometheus
relabel_config的区别 :按采集器过滤 VS 按metric_name 或label过滤
原理: 通过http请求参数过滤采集器
- collect参数解析在 D:\nyy_work\go_path\src\github.com\prometheus\node_exporter\node_exporter.go
- 根据http传入的collect参数,进行filter采集模块过滤
- 将过滤后的模块注册到prometheus采集器上
func (h *handler) ServeHTTP(w http.ResponseWriter, r *http.Request) {
	filters := r.URL.Query()["collect[]"]
	level.Debug(h.logger).Log("msg", "collect query:", "filters", filters)

	if len(filters) == 0 {
		// No filters, use the prepared unfiltered handler.
		h.unfilteredHandler.ServeHTTP(w, r)
		return
	}
	// To serve filtered metrics, we create a filtering handler on the fly.
	filteredHandler, err := h.innerHandler(filters...)
	if err != nil {
		level.Warn(h.logger).Log("msg", "Couldn't create filtered metrics handler:", "err", err)
		w.WriteHeader(http.StatusBadRequest)
		w.Write([]byte(fmt.Sprintf("Couldn't create filtered metrics handler: %s", err)))
		return
	}
	filteredHandler.ServeHTTP(w, r)
}
node_exporter主流程源码追踪
- node exporter各个模块注册, innerHandler调用对应的collect()
- node exporter根据sdk中 collect().execute().各模块的update()
采集器的初始化
- 初始化handler
- 源码位置 D:\nyy_work\go_path\pkg\mod\github.com\prometheus\node_exporter@v1.2.2\node_exporter.go
http.Handle(*metricsPath, newHandler(!*disableExporterMetrics, *maxRequests, logger))
- 调用 newHandler,其中最关键一句是 innerHandler
	if innerHandler, err := h.innerHandler(); err != nil {
		panic(fmt.Sprintf("Couldn't create metrics handler: %s", err))
- 调用 innerHandler ,其中干这么几件事
- 根据过滤器初始化node_collector nc
- 把 nc注册到 prometheus的 registry 上
r.Register(nc)
- 源码如下
func (h *handler) innerHandler(filters ...string) (http.Handler, error) {
	nc, err := collector.NewNodeCollector(h.logger, filters...)
	if err != nil {
		return nil, fmt.Errorf("couldn't create collector: %s", err)
	}

	// Only log the creation of an unfiltered handler, which should happen
	// only once upon startup.
	if len(filters) == 0 {
		level.Info(h.logger).Log("msg", "Enabled collectors")
		collectors := []string{}
		for n := range nc.Collectors {
			collectors = append(collectors, n)
		}
		sort.Strings(collectors)
		for _, c := range collectors {
			level.Info(h.logger).Log("collector", c)
		}
	}

	r := prometheus.NewRegistry()
	r.MustRegister(version.NewCollector("node_exporter"))
	if err := r.Register(nc); err != nil {
		return nil, fmt.Errorf("couldn't register node collector: %s", err)
	}
	handler := promhttp.HandlerFor(
		prometheus.Gatherers{h.exporterMetricsRegistry, r},
		promhttp.HandlerOpts{
			ErrorLog:            stdlog.New(log.NewStdlibAdapter(level.Error(h.logger)), "", 0),
			ErrorHandling:       promhttp.ContinueOnError,
			MaxRequestsInFlight: h.maxRequests,
			Registry:            h.exporterMetricsRegistry,
		},
	)
	if h.includeExporterMetrics {
		// Note that we have to use h.exporterMetricsRegistry here to
		// use the same promhttp metrics for all expositions.
		handler = promhttp.InstrumentMetricHandler(
			h.exporterMetricsRegistry, handler,
		)
	}
	return handler, nil
}
NewNodeCollector 初始化nc
- 源码位置 D:\nyy_work\go_path\pkg\mod\github.com\prometheus\node_exporter@v1.2.2\collector\collector.go
- 根据 各个模块注册的 collectorState获取他们的执行函数 collector
// NewNodeCollector creates a new NodeCollector.
func NewNodeCollector(logger log.Logger, filters ...string) (*NodeCollector, error) {
	f := make(map[string]bool)
	for _, filter := range filters {
		enabled, exist := collectorState[filter]
		if !exist {
			return nil, fmt.Errorf("missing collector: %s", filter)
		}
		if !*enabled {
			return nil, fmt.Errorf("disabled collector: %s", filter)
		}
		f[filter] = true
	}
	collectors := make(map[string]Collector)
	initiatedCollectorsMtx.Lock()
	defer initiatedCollectorsMtx.Unlock()
	for key, enabled := range collectorState {
		if !*enabled || (len(f) > 0 && !f[key]) {
			continue
		}
		if collector, ok := initiatedCollectors[key]; ok {
			collectors[key] = collector
		} else {
			collector, err := factories[key](log.With(logger, "collector", key))
			if err != nil {
				return nil, err
			}
			collectors[key] = collector
			initiatedCollectors[key] = collector
		}
	}
	return &NodeCollector{Collectors: collectors, logger: logger}, nil
}
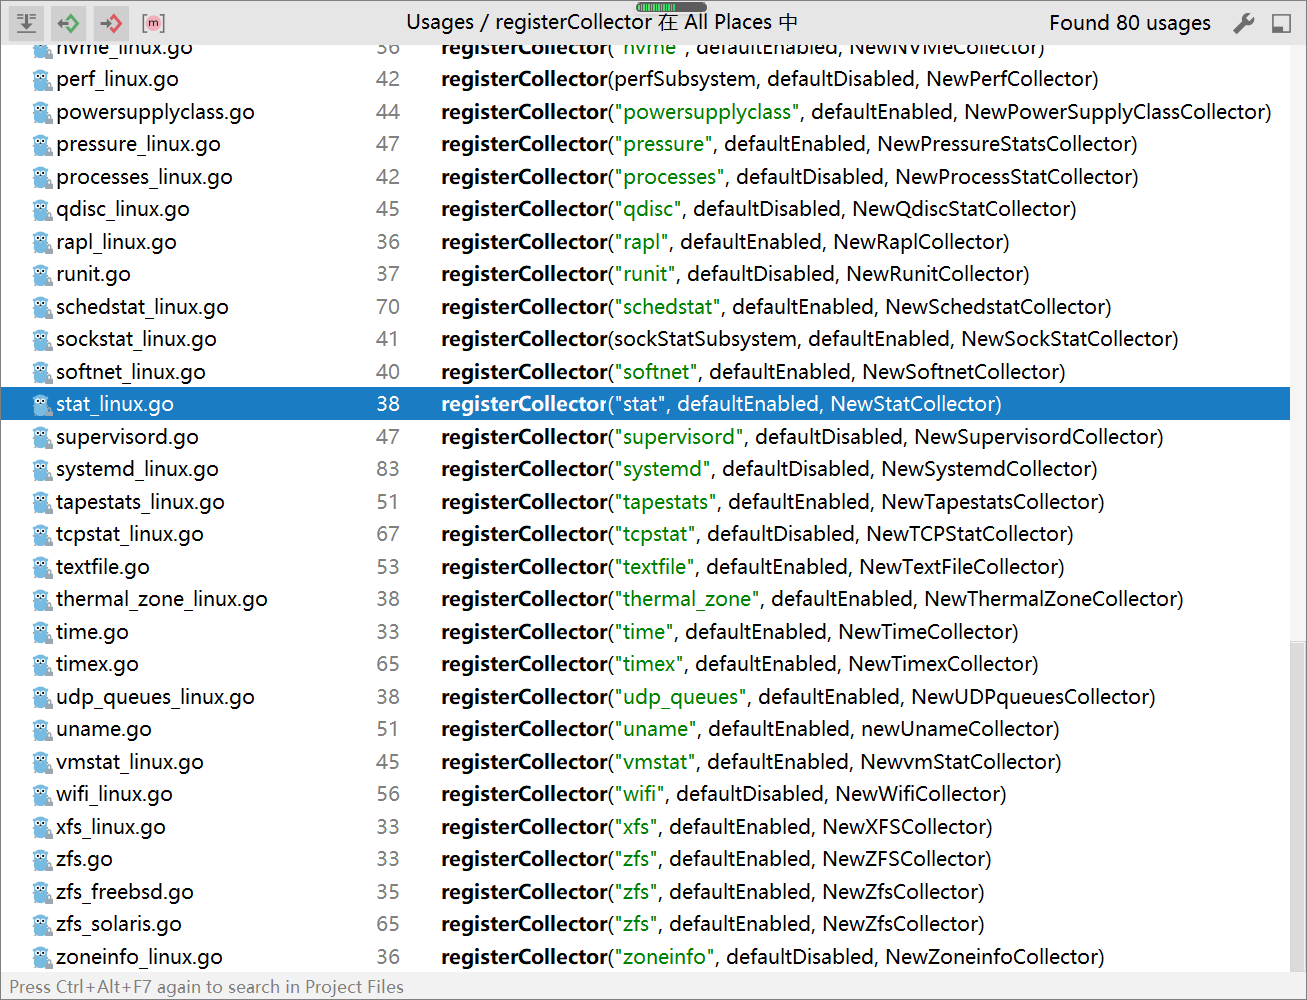
- 各个模块会调用 在各自的init 函数中调用 registerCollector ,向 collectorState和factories注册自己
func registerCollector(collector string, isDefaultEnabled bool, factory func(logger log.Logger) (Collector, error)) {
	var helpDefaultState string
	if isDefaultEnabled {
		helpDefaultState = "enabled"
	} else {
		helpDefaultState = "disabled"
	}

	flagName := fmt.Sprintf("collector.%s", collector)
	flagHelp := fmt.Sprintf("Enable the %s collector (default: %s).", collector, helpDefaultState)
	defaultValue := fmt.Sprintf("%v", isDefaultEnabled)

	flag := kingpin.Flag(flagName, flagHelp).Default(defaultValue).Action(collectorFlagAction(collector)).Bool()
	collectorState[collector] = flag

	factories[collector] = factory
}
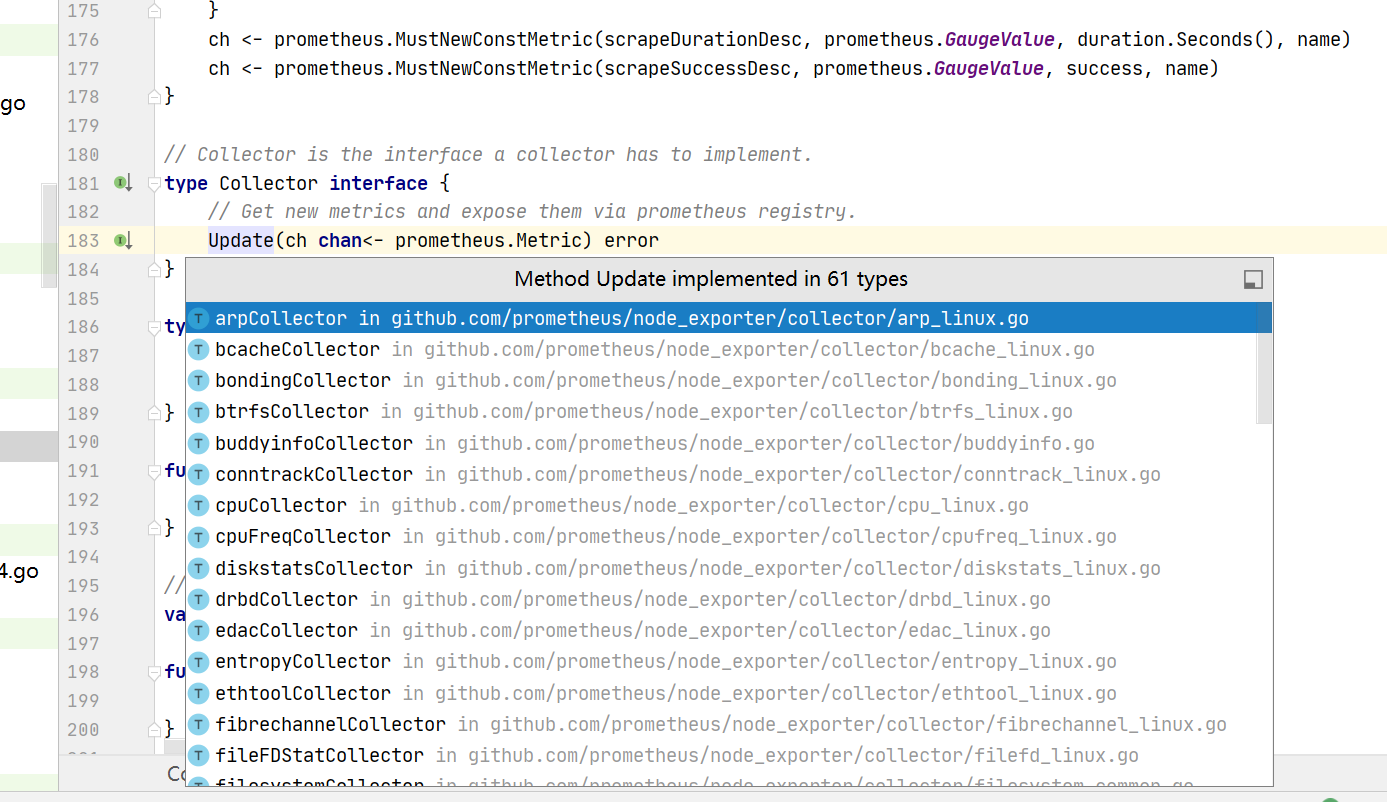
执行采集
- prometheus sdk中执行采集就是执行对应的 Collect方法
- 源码位置 D:\nyy_work\go_path\pkg\mod\github.com\prometheus\node_exporter@v1.2.2\collector\collector.go
// Collect implements the prometheus.Collector interface.
func (n NodeCollector) Collect(ch chan<- prometheus.Metric) {
	wg := sync.WaitGroup{}
	wg.Add(len(n.Collectors))
	for name, c := range n.Collectors {
		go func(name string, c Collector) {
			execute(name, c, ch, n.logger)
			wg.Done()
		}(name, c)
	}
	wg.Wait()
}
- 调用 execute函数,可以看到就是调用各个 collector模块的 update函数
mem采集模块的内容
- Update源码位置 D:\nyy_work\go_path\pkg\mod\github.com\prometheus\node_exporter@v1.2.2\collector\meminfo.go
- 源码如下
// Update calls (*meminfoCollector).getMemInfo to get the platform specific
// memory metrics.
func (c *meminfoCollector) Update(ch chan<- prometheus.Metric) error {
	var metricType prometheus.ValueType
	memInfo, err := c.getMemInfo()
	if err != nil {
		return fmt.Errorf("couldn't get meminfo: %w", err)
	}
	level.Debug(c.logger).Log("msg", "Set node_mem", "memInfo", memInfo)
	for k, v := range memInfo {
		if strings.HasSuffix(k, "_total") {
			metricType = prometheus.CounterValue
		} else {
			metricType = prometheus.GaugeValue
		}
		ch <- prometheus.MustNewConstMetric(
			prometheus.NewDesc(
				prometheus.BuildFQName(namespace, memInfoSubsystem, k),
				fmt.Sprintf("Memory information field %s.", k),
				nil, nil,
			),
			metricType, v,
		)
	}
	return nil
}
- 内容分析
- 通过c.getMemInfo() 获取到memInfo
- 在linux 中memInfo中对应的就是 /proc/meminfo ,逐行解析
- 遍历推送即可
自定义一个node exporter模块的二开方法
eg:
- collect/目录下新建一个 errlog.go
- 定义一个结构体体errLogCollector
type errLogCollector struct {
	logger log.Logger
}
- 写一个new xxCollector的工厂函数,一个参数为 log.logger
func NewErrLogCollector(logger log.Logger) (Collector, error) {
	return &errLogCollector{logger}, nil
}
- 写一个 init方法调用 registerCollector 注册自己
const (
	errLogSubsystem = "errlog"
)
func init() {
	registerCollector(errLogSubsystem, defaultEnabled, NewErrLogCollector)
}
- 给这个结构体绑定一个Update方法,签名如下
func (c *xxCollector) Update(ch chan<- prometheus.Metric) error {}
完成这个Update方法
流程说明
- 分析 日志文件
- $5是app的名字
- 有info error等level字段
Aug 15 09:54:02 prome-master01 containerd: time="2021-08-15T09:54:02.839718531+08:00" level=info msg="ExecSync for \"cedb3c6d71c0422dfe95d16b242fd08e78096606f1f9614e945cc99581b92f92\" returns with exit code 1"
- 执行awk可以得到一个日志文件中错误日志按app name进行分布的结果
grep -i error /var/log/messages-20210814 |awk '{a[$5]++}END{for(i in a) print i,a[i]}'
telegraf: 3872
pushgateway: 2
kubelet: 16822
containerd: 9350
kernel: 5
grafana-server: 10
新增一个执行shell命令的函数
func errLogGrep() string {
	errLogCmd := `grep -i error /var/log/messages |awk '{a[$5]++}END{for(i in a) print i,a[i]}'`
	cmd := exec.Command("sh", "-c", errLogCmd)
	output, _ := cmd.CombinedOutput()
	return string(output)

}
然后在Update中按行遍历
- 按行遍历之后再按 :分割就能得到 appname 和value
- 然后将name中的 - 替换为_
- value 字符串转换为int
- 然后构建一个 metric对象塞入ch中即可
func (c *errLogCollector) Update(ch chan<- prometheus.Metric) error {
	var metricType prometheus.ValueType
	metricType = prometheus.GaugeValue
	output := errLogGrep()
	for _, line := range strings.Split(output, "\n") {
		l := strings.Split(line, ":")
		if len(l) != 2 {
			continue
		}
		name := strings.TrimSpace(l[0])
		value := strings.TrimSpace(l[1])
		v, _ := strconv.Atoi(value)
		name = strings.Replace(name, "-", "_", -1)
		level.Debug(c.logger).Log("msg", "Set errLog", "name", name, "value", value)

		ch <- prometheus.MustNewConstMetric(
			prometheus.NewDesc(
				prometheus.BuildFQName(namespace, errLogSubsystem, name),
				fmt.Sprintf("/var/log/message err log %s.", name),
				nil, nil,
			),
			metricType, float64(v),
		)
	}
	return nil
}
运行我们的程序
- 打包
- 编译 go build -v node_exporter.go
- 然后运行 ./node_exporter --web.listen-address=“:9101”
- 查询errlog metrics
[root@prome-master01 tgzs]# curl -s localhost:9101/metrics |grep node_errlog
# HELP node_errlog_containerd /var/log/message err log containerd.
# TYPE node_errlog_containerd gauge
node_errlog_containerd 9350
# HELP node_errlog_grafana_server /var/log/message err log grafana_server.
# TYPE node_errlog_grafana_server gauge
node_errlog_grafana_server 10
# HELP node_errlog_kernel /var/log/message err log kernel.
# TYPE node_errlog_kernel gauge
node_errlog_kernel 5
# HELP node_errlog_kubelet /var/log/message err log kubelet.
# TYPE node_errlog_kubelet gauge
node_errlog_kubelet 16822
# HELP node_errlog_pushgateway /var/log/message err log pushgateway.
# TYPE node_errlog_pushgateway gauge
node_errlog_pushgateway 2
# HELP node_errlog_telegraf /var/log/message err log telegraf.
# TYPE node_errlog_telegraf gauge
node_errlog_telegraf 3872
完整的errlog.go
// Copyright 2015 The Prometheus Authors
// Licensed under the Apache License, Version 2.0 (the "License");
// you may not use this file except in compliance with the License.
// You may obtain a copy of the License at
//
// http://www.apache.org/licenses/LICENSE-2.0
//
// Unless required by applicable law or agreed to in writing, software
// distributed under the License is distributed on an "AS IS" BASIS,
// WITHOUT WARRANTIES OR CONDITIONS OF ANY KIND, either express or implied.
// See the License for the specific language governing permissions and
// limitations under the License.

// +build darwin linux openbsd
// +build !nomeminfo

package collector

import (
	"fmt"
	"os/exec"
	"strconv"
	"strings"

	"github.com/go-kit/log"
	"github.com/go-kit/log/level"
	"github.com/prometheus/client_golang/prometheus"
)

const (
	errLogSubsystem = "errlog"
)

type errLogCollector struct {
	logger log.Logger
}

func init() {
	registerCollector(errLogSubsystem, defaultEnabled, NewErrLogCollector)
}

// NewMeminfoCollector returns a new Collector exposing memory stats.
func NewErrLogCollector(logger log.Logger) (Collector, error) {
	return &errLogCollector{logger}, nil
}

func errLogGrep() string {
	errLogCmd := `grep -i error /var/log/messages |awk '{a[$5]++}END{for(i in a) print i,a[i]}'`
	cmd := exec.Command("sh", "-c", errLogCmd)
	output, _ := cmd.CombinedOutput()
	return string(output)

}

// Update calls (*meminfoCollector).getMemInfo to get the platform specific
// memory metrics.
func (c *errLogCollector) Update(ch chan<- prometheus.Metric) error {
	var metricType prometheus.ValueType
	metricType = prometheus.GaugeValue
	output := errLogGrep()
	for _, line := range strings.Split(output, "\n") {
		l := strings.Split(line, ":")
		if len(l) != 2 {
			continue
		}
		name := strings.TrimSpace(l[0])
		value := strings.TrimSpace(l[1])
		v, _ := strconv.Atoi(value)
		name = strings.Replace(name, "-", "_", -1)
		level.Debug(c.logger).Log("msg", "Set errLog", "name", name, "value", value)

		ch <- prometheus.MustNewConstMetric(
			prometheus.NewDesc(
				prometheus.BuildFQName(namespace, errLogSubsystem, name),
				fmt.Sprintf("/var/log/message err log %s.", name),
				nil, nil,
			),
			metricType, float64(v),
		)
	}
	return nil
}


 1640
1640


 被折叠的 条评论
为什么被折叠?
被折叠的 条评论
为什么被折叠?
 到【灌水乐园】发言


