


一、背景概述
数据看板在企业生产经营的重要性
数据看板(Dashboard)在现代企业生产经营中扮演着至关重要的角色,其重要性体现在以下几个方面:
- 实时监控与决策支持: 数据看板能够实时展示关键业务指标(KPIs),帮助管理者快速了解企业运营状况,及时发现问题并做出调整。相比传统报表,数据看板的时效性和直观性大大提高,为快速决策提供了有力支持。
- 提高效率与协作: 数据看板将分散在不同系统中的数据整合到一个统一的视图中,减少了数据查找和整理的时间,提高了工作效率。同时,数据看板可以共享给不同部门和团队,促进信息共享和跨部门协作。
- 数据驱动文化: 数据看板的使用可以培养企业的数据驱动文化,鼓励员工基于数据进行分析和决策,而不是依靠经验和直觉。这种文化有助于提高决策的科学性和准确性。
- 问题发现与预警: 数据看板可以通过设置阈值和预警规则,及时发现潜在的风险和问题。例如,库存过高、销售额下降等异常情况可以通过数据看板及时发现,从而采取相应的措施。
- 绩效评估与改进: 数据看板可以清晰地展示各部门和员工的绩效,帮助管理者进行客观评估,并找出需要改进的地方。
- 客户洞察: 对于面向客户的企业,数据看板可以展示客户行为、偏好等信息,帮助企业更好地了解客户需求,提供个性化服务,提高客户满意度。
美的集团要求开会使用数据看板而不是PPT,体现了其对数据驱动决策的重视。PPT 往往是静态的、事后总结性的,而数据看板是实时的、动态的、可交互的。这种转变的核心优势在于:
- 实时性: 数据看板连接实时数据源,能够反映最新的业务情况,而PPT通常是基于历史数据制作。
- 互动性: 数据看板允许用户进行筛选、钻取等操作,深入分析数据,而PPT则缺乏这种交互性。
- 聚焦问题: 数据看板能够快速定位问题和异常,而PPT则需要花费更多时间去解读。
- 提高效率: 使用数据看板可以减少会议准备时间,提高会议效率,使会议更加聚焦于问题解决和决策。
当前数据看板系统存在的问题
尽管数据看板系统已经得到了广泛应用,但仍然存在一些问题:
- 数据质量问题: 数据看板的准确性和可靠性依赖于底层数据的质量。如果数据存在错误、缺失、不一致等问题,将会影响数据看板的呈现效果和决策的准确性。
- 数据孤岛问题: 企业内部不同部门和系统之间的数据往往是分散的、独立的,难以整合到一个统一的数据看板中。
- 过度依赖IT部门: 许多数据看板系统的使用需要一定的技术门槛,业务部门往往需要依赖IT部门来创建和维护数据看板。
- 缺乏业务洞察: 有些数据看板过于注重数据的展示,而缺乏对数据的深入分析和解读,无法提供有价值的业务洞察。
- 设计不合理: 一些数据看板的设计不够直观、美观,信息过载,导致用户难以快速找到关键信息。
- 成本问题: 一些商业数据看板软件的许可证费用较高,对于中小型企业来说可能难以承受。
在前一篇博客中,我们成功构建了一个多智能体协作平台。该平台允许用户创建多种智能体,并通过它们之间的协作来解决各种问题。因此本文将讨论并实践利用多智能体协作将数据分析、数据看板制作等整合在一起,实现无代码、自主、快速的数据看板制作,降低数据看板制作成本。
整体流程
代码实践
数据看板模板信息。
{
    "Modern Minimalist Dashboard": {
      "Description": "A Modern Minimalist Dashboard typically features clean, sharp lines and ample whitespace to create a contemporary, professional look that's easy on the eyes and focuses attention effectively. The color scheme is usually restrained, favoring monochromatic or low-saturation colors such as light gray, dark blue, or white backgrounds with accents of highlight colors.",
      "Key Elements": {
        "Card Layout": "Modular information presentation where each card clearly displays one key metric or chart.",
        "Top Navigation Bar": "Enables quick switching between different dashboards or functional modules.",
        "Simplified Charts": "Commonly uses straightforward chart types like bar charts, line graphs, and numeric cards without excessive decoration.",
        "Icon Usage": "Employs simple linear or flat icons to support information delivery and enhance visual guidance.",
        "Highlight Colors for Key Metrics": "Utilizes striking colors (like bright blue, green, or orange) to emphasize important KPI figures or critical charts.",
        "Clear Typography": "Selects legible sans-serif fonts such as Roboto, Open Sans, Lato, etc."
      },
      "Suitable Scenarios": "Ideal for scenarios requiring a quick overview of key business metrics, emphasizing efficiency and clarity, suitable for executive dashboards, operational monitoring, etc."
    },
    "Vibrant & Colorful Dashboard": {
      "Description": "This style of dashboard features vivid and lively colors, using bold contrasting or gradient colors to create a vibrant and attractive visual effect. While being colorful, it generally maintains an overall balance and harmony, avoiding overly fancy designs.",
      "Key Elements": {
        "Dark Background or Light Background with Bright Colors": "For example, dark blue or black background paired with neon color schemes, or light gray background with bright contrasting colors.",
        "Geometric Shapes and Patterns": "May use geometric shapes or abstract patterns as background or decorative elements, adding layers to the visual experience.",
        "Rich Chart Types": "In addition to basic charts, may use more expressive chart types like scatter plots, bubble charts, funnel charts, etc.",
        "Data Visualization Storytelling": "Focuses more on telling data stories visually, e.g., through infographics, flowcharts, etc.",
        "Animations and Micro-interactions": "May incorporate subtle animation effects or micro-interactions, such as chart loading animations, hover effects, etc., enhancing user experience."
      },
      "Suitable Scenarios": "Suitable for scenarios needing to attract users' attention, used in marketing data analysis, social media monitoring, event effectiveness analysis, and other scenarios requiring stronger visual impact."
    },
    "Classic Business Dashboard": {
      "Description": "This style of dashboard is steady and professional, with a color scheme often using classic business tones such as dark blue, gray, green, etc., creating a trustworthy and authoritative image. The layout is neat and rigorous, presenting information clearly and orderly.",
      "Key Elements": {
        "Light Background with Dark Text and Charts": "For example, white or light gray background, dark blue or black text and chart lines.",
        "Tables and Charts Combined": "Uses tables extensively to display detailed data; charts are used to summarize trends and comparisons.",
        "Side Navigation Bar": "Used to organize and switch between different dashboards or report modules, with clear hierarchical structure.",
        "Detailed Chart Elements": "E.g., clear axis labels, gridlines, data labels, focusing on accurate data representation.",
        "Emphasizing Data Accuracy": "Design leans towards rigor, minimizing decorative elements, highlighting the credibility and analytical value of data."
      },
      "Suitable Scenarios": "Suitable for scenarios requiring detailed business data presentation, emphasizing depth and professionalism in data analysis, applicable for financial reports, sales analysis, supply chain management, and other traditional business analysis scenarios."
    },
    "Gauge-centric Dashboard": {
      "Description": "This style of dashboard centers around gauge charts, prominently displaying the achievement status of key performance indicators (KPIs). Gauge charts usually occupy a prominent position, intuitively showing current values, target values, and progress.",
      "Key Elements": {
        "Centralized Gauge Charts": "Places the most important KPIs in large gauge charts at the center of the dashboard, drawing the user's immediate attention.",
        "Supporting Charts Around Gauges": "Uses supporting charts like line graphs, bar charts, pie charts, etc., to interpret KPI trends, compositions, and influencing factors from different dimensions.",
        "Progress Bars and Donut Charts": "In addition to gauge charts, also commonly uses progress bars or donut charts to show the completion progress of targets.",
        "Color Coding": "Uses colors (e.g., red, yellow, green) to visually indicate the health status or achievement level of KPIs.",
        "Simple Layout Highlighting KPIs": "Keeps the layout simple, avoiding irrelevant information that could distract from quickly understanding the status of KPIs."
      },
      "Suitable Scenarios": "Suitable for scenarios needing real-time monitoring of key performance indicators, quickly understanding business health status, applicable for operational monitoring centers, project management dashboards, etc."
    },
    "Geospatial Dashboard": {
      "Description": "This style of dashboard primarily uses maps as its main visual element, combining data with geographic location information to visualize regional distribution, area differences, etc., through map visualization.",
      "Key Elements": {
        "Interactive Maps": "Uses map charts (e.g., dot maps, heatmaps, choropleth maps) to display geographical data, supporting zooming, panning, and data point interactions.",
        "Data Layer Overlay": "Can overlay multiple data layers on the map, such as sales, customer distribution, market share, etc., for multidimensional analysis.",
        "Region Filters": "Provides region filters, such as countries, provinces, cities, etc., allowing users to freely explore data across different regions.",
        "Info Bubbles and Pop-ups": "Clicking on areas or data points on the map pops up info bubbles or windows displaying detailed data information.",
        "Geocoding": "Requires data containing geographical information, such as latitude/longitude, city names, postal codes, etc."
      },
      "Suitable Scenarios": "Suitable for analyzing geographically-related data, such as sales territory distribution, market area analysis, logistics transportation monitoring, geographic location marketing, etc."
    },
    "Sales Dashboard Design":{
      "Description": "The sales dashboard design is created to provide valuable insights into profits, customers, and team productivity, making data-driven decisions easier for business owners.",
      "Key Elements": {
        "Card Layout": "The dashboard uses a card layout to organize different data points into visually distinct sections.",
        "Top Navigation Bar": "A top navigation bar is included for easy access to different sections and features of the dashboard.",
        "Simplified Charts": "Charts are simplified to display key metrics and trends without overwhelming the user with too much information.",
        "Icon Usage": "Icons are used to represent different data categories and actions, enhancing visual clarity and quick recognition.",
        "Highlight Colors for Key Metrics": "Key metrics are highlighted using distinct colors to draw attention and make them easily identifiable.",
        "Clear Typography": "Clear and consistent typography is used throughout the dashboard to improve readability and user experience."
      },
      "Suitable Scenarios": "The dashboard is suitable for business owners and managers who need to monitor and analyze sales performance, customer behavior, and team productivity."
    }

  }
数据看板及数据分析流程生成器
生成数据分析流程信息、数据看板设计要点。
def dash_board_prompt_info(prompt,data_file_path,dash_board_template):
    llm = ChatOpenAI(model=model_use,temperature=0.5)
    data_info = get_multi_full_file_info(data_file_path)
    messages = [
        ("system", f"""`
          You are a data dashboard designer.
         Based on the user's data : data_file_path:[{data_file_path}] and overview:[{data_info}], and the data dashboard template:[{dash_board_template}] requirements, please provide a comprehensive data dashboard design specification.
         In addition, include the key points for implementing the dashboard using Plotly.
         You should provide a detailed task solution, including key points for data analysis, a design plan for the data dashboard, information on database tables, etc., without the need to develop code samples.
         The dash board final output is a dashboard html file.
         Here is an example of how to do this:
                        import plotly.graph_objects as go
                        from plotly.subplots import make_subplots
                        data = ....
                        fig = make_subplots(rows=2, cols=1, subplot_titles=("图表 1", "图表 2"))                        # 添加第一个图表到布局中
                        fig.add_trace(go.Scatter(x=data['x'], y=data['y1'], mode='lines', name='数据系列 1'), row=1, col=1)
                        # 添加第二个图表到布局中
                        fig.add_trace(go.Scatter(x=data['x'], y=data['y2'], mode='lines', name='数据系列 2'), row=2, col=1)
                        # 更新布局
                        fig.update_layout(height=600, width=800, title_text="多图表布局")
                        # 保存图表为HTML文件
                        fig.write_html("workdir_/plotly_dashboard.html")
        The design of the data dashboard takes into full consideration the layout of the data dashboard templates, while adhering to the following design principles:
          1.Simplicity and Intuitiveness: The design should be straightforward, allowing users to quickly access the information they need without excessive features or visual elements.
          2.Consistency: Use consistent design elements like fonts, colors, and icons to help users better understand and navigate the dashboard.
          3.Prioritize Information: Important data should be prominently displayed and highlighted through color or size. The data should be logically organized for easy access.
          4.Responsive Design: Ensure the dashboard displays correctly on various screen sizes and devices using a flexible grid system and responsive design techniques.
          5.Effective Use of White Space: Properly use white space to enhance readability and visual appeal, avoiding overcrowded or overly sparse designs.
        The overall output should be between 1500 and 2500 words."""

        ),
          ("human", prompt),
          ]
    cob_result_ = llm.invoke(messages)
    return cob_result_.content
数据看板代码生成及执行
def dash_board_code_write_execute_agents(user_message,workdir_,max_turns=None):
  # code write and excute agents
  # params:
    # agents_info : 你想通过写代码解决那类通用问题
    # user_message : 你的问题
    # workdir : 代码工作文件夹,将会生成多个文件夹,每一步的结果将会保存,包括临时生成的代码
  # 流程:
    #1、会将用户的任务进行拆解,拆解成若干个可执行的子任务
    #2、针对各个子任务编写代码并执行,执行结果包含csv文件、png文件、py文件等
    #3、过程报错文件存在各步骤临时文件夹内 _erro_log.json
  date_str = datetime.now().strftime('%Y%m%d')
  # 生成4位随机字母字符串
  rand_str = ''.join(random.choices(string.ascii_uppercase, k=4))
  # 创建子文件夹名称
  subfolder_name = f"data_{date_str}_{rand_str}"
  workdir = os.path.join(workdir_, subfolder_name)
  if os.path.exists(workdir):
    if os.path.isdir(workdir):
        shutil.rmtree(workdir)
    else:
        raise ValueError(f"{workdir} exists but is not a directory")
  os.makedirs(workdir)

  def code_write_execute_agent(task_prompt, work_dir, max_turns=None):
      """
      整合了代码生成、执行和日志保存功能的代理函数。

      参数:
      - task_prompt (str): 用户任务提示。
      - work_dir (str): 工作目录路径。
      - max_turns (int, optional): 最大迭代次数。默认为 None,表示无限制。

      返回:
      - None
      """

      def create_directory_if_not_exists(dir_path):
          """创建目录,如果目录已存在则不抛出异常"""
          if not os.path.exists(dir_path):
              os.makedirs(dir_path)

      def save_log(log_dir, step, feedback_prompt):
          """保存日志信息到 JSON 文件"""
          log_entry = {
              "step": step,
              "feedback_prompt": feedback_prompt,
              "timestamp": time.strftime("%Y-%m-%d %H:%M:%S", time.localtime())
          }
          log_file = os.path.join(log_dir, f'_error_log.json')
          with open(log_file, 'a', encoding='utf-8') as f:
              json.dump(log_entry, f, ensure_ascii=False, indent=4)

      @retry(stop=stop_after_attempt(3), wait=wait_fixed(2))
      def code_write_agent(task_prompt, feedback_prompt, workdir):
          llm = ChatOpenAI(model=model_use,temperature=0.05)
          messages = [
              ("system", """
                  You are a professional **Python code generation assistant**, dedicated to accurately generating Python code based on user needs. To ensure clarity and thoroughness in problem-solving, follow these steps:
                  ### Step 1: **Problem Understanding**
                  - Carefully read the user's query to identify key objectives and challenges.
                  - Ask clarifying questions if the problem statement is ambiguous or incomplete.

                  ### Step 2: **Code Generation**
                  - For each subtask:
                    - Write Python code that adheres to best practices and coding standards.
                    - Add **detailed inline comments** to explain key steps, logic, and functionality.
                    - Ensure the code is modular and reusable where appropriate.

                  ### Step 3: **Execution and Path Handling**
                  - Provide instructions for running the code and highlight any dependencies.
                  - Ensure file paths and save locations are **aligned with the working directory** for seamless execution.

                  ### Step 4: **Feedback Iteration**
                  - If the user reports errors:
                    - Analyze error messages to locate and fix bugs.
                  - If the results deviate from expectations:
                    - Adjust logic, refine algorithms, or modify parameters accordingly.
                  - Provide an explanation for each fix or modification to help users understand the changes.

                  ### Step 5: **Output task_complete_state **
                  Based on your evaluation, you will output one of the following states:
                  1. If the code has fully solved the problem without any errors, output “COMPLETED.”
                  2. If the code has partially solved the problem without any errors, output “PART.”
                  3. If there are errors after execution, output “TEMP.”

                  ### Step 6: **Final Optimization**
                  - [Note]Iterate on the solution until it fully satisfies the user's requirements!
                  - Guarantee that the final version is **directly executable** without further modification.

               [Important] Ensure that you correctly manage escape characters within the string. Specifically, address any issues with newline characters and quotation marks in the original string. This preprocessing step is necessary to transform the string into a valid JSON format.
               【Note】Output them in JSON format,Please note, do not output additional information, only output content in JSON format,Example Output:

                  ```json
                  {
                    "solution": "<Detailed explanation of the solution>",
                    "python_code": "<Your Python code here,Ensure that any special characters are properly escaped,For example,use \\ for backslashes and \" for double quotes>",
                    "python_file_name": "<A python file name related to the user's question, like xxx.py>",
                    "task_complete_state": "<State above 'TEMP', 'PART', 'COMPLETELY'>",
                    "summary": "<Please provide a summary of the problem and the solution. Include the file paths of all types of files(exampe:xx/xx/xx.csv,xx/xx/xx/xx.png) generated by the code execution. Generate new data information using df.head() and df.info() to provide an overview of the data.>"
                  }
                """ + 'Note:All output file dir is:' + str(workdir)),
              ("human", f"""
                    The user's question is:
                  {task_prompt}
                  \n The user's feedback is: {feedback_prompt}, please help me to write the new code.
                    """),
          ]

          ai_msg = llm.invoke(messages)
          cob_result = ai_msg.content
          return cob_result

      #@retry(stop=stop_after_attempt(3), wait=wait_fixed(2))
      def code_execute_agent(code_py):
          try:
              with open(code_py, encoding='utf-8') as f:
                  code = f.read()
                  exec(code)
          except Exception as e:
              tb = traceback.extract_tb(e.__traceback__)
              error_info = {
                  'error_type': type(e).__name__,
                  'error_message': str(e),
                  'traceback': [
                      {
                          'filename': frame.filename,
                          'lineno': frame.lineno,
                          'name': frame.name,
                          'line': frame.line
                      }
                      for frame in tb
                  ]
              }

              return error_info
          else:
              return True

      initial_feedback_prompt = "None"
      feedback_prompt = initial_feedback_prompt
      step = 1
      code_execute = True

      # 创建工作目录
      create_directory_if_not_exists(work_dir)
      temp_dir = os.path.join(work_dir, "temp")
      create_directory_if_not_exists(temp_dir)
      task_complete_state = 'TEMP'
      feedback_info = "None"
      while code_execute and (max_turns is None or step <= max_turns) and task_complete_state != 'COMPLETELY':
          try:
              python_code = code_write_agent(task_prompt, str(feedback_info), work_dir)
              json_str = python_code.replace('```json', '').replace('```', '').strip()
              json_data = json.loads(json_str)

              py_file = os.path.join(temp_dir, json_data['python_file_name'] + f'_tempfile_step_{step}.py')
              with open(py_file, 'w', encoding='utf-8') as f:
                  f.write(json_data['python_code'])

              feedback_prompt = code_execute_agent(py_file)
              feedback_info = code_execute_erro_optimize_agent(task_prompt, feedback_prompt)
              if feedback_prompt is True:
                  code_execute = False
              save_log(temp_dir, step, feedback_prompt)
              task_complete_state = json_data['task_complete_state']
              print(f'----------step: {step}----------\n{feedback_prompt}')
              step += 1
              time.sleep(10)

          except Exception as e:
              print(f"发生错误: {e}")
              traceback.print_exc()
              code_execute = True
              step += 1

      if feedback_prompt is True:
          final_py_file = os.path.join(work_dir, json_data['python_file_name'])
          with open(final_py_file, 'w', encoding='utf-8') as f:
              f.write(json_data['python_code'])
          code_execute_summary = json_data['summary']
      else:
          print('本次任务尚未完成,请再行优化')
          code_execute_summary = 'error'
      return code_execute_summary
  def dash_board_result(user_message,max_turns):
      llm = ChatOpenAI(model=model_use,temperature=0.5)
      messages_cob = [
              ("system", """You are a task result optimizer. Please organize the content based on user input, including the task name, task overview, task solution, and the absolute address of the output HTML file.
               [Important] Ensure that you correctly manage escape characters within the string. Specifically, address any issues with newline characters and quotation marks in the original string. This preprocessing step is necessary to transform the string into a valid JSON format.
               【Note】Output them in JSON format,Please note, do not output additional information, only output content in JSON format,Example Output:
               ```json
                    {
                        "task_name": "<task name>",
                        "task_overview": "<task overview>",
                        "task_solution": "<task solution>",
                        "output_html_path": "<absolute address of the output HTML file, like /home/user/plotly_dashboard.html>"
                      }
                    """),
              ("human", user_message),
              ]
      cob_result_ = llm.invoke(messages_cob)
      cob_result = cob_result_.content
      json_str = cob_result.replace('```json', '').replace('```', '').strip()
      json_data = json.loads(json_str)
      return json_data
  result = code_write_execute_agent(work_dir=workdir_,task_prompt=user_message,max_turns=max_turns)
  json_data = dash_board_result(result,max_turns)
  return json_data

def dash_board_code_gen(task_prompt,data_file_path,dash_board_template,workdir_):
    data_info = get_multi_full_file_info(data_file_path)
    dash_info_for_html = f"""
                         Note:Please be aware that you must use Plotly to generate the data dashboard as an HTML file.
                         Ensure that all generated charts are contained within a single HTML file(use fig.save('.......html')).
                         Here is an example of how to do this:
                        import plotly.graph_objects as go
                        from plotly.subplots import make_subplots
                        # 创建一些示例数据
                        data = dict(
                            x=[1, 2, 3, 4, 5],
                            y1=[10, 11, 12, 11, 10],
                            y2=[1, 2, 2, 3, 3]
                        )
                        # 创建带有两个子图的布局
                        fig = make_subplots(rows=2, cols=1, subplot_titles=("图表 1", "图表 2"))                        # 添加第一个图表到布局中
                        fig.add_trace(go.Scatter(x=data['x'], y=data['y1'], mode='lines', name='数据系列 1'), row=1, col=1)
                        # 添加第二个图表到布局中
                        fig.add_trace(go.Scatter(x=data['x'], y=data['y2'], mode='lines', name='数据系列 2'), row=2, col=1)
                        # 更新布局
                        fig.update_layout(height=600, width=800, title_text="多图表布局")
                        # 保存图表为HTML文件
                        fig.write_html("{workdir_}/plotly_dashboard.html")
                          """
    dash_board_info = f"根据用户的问题,即{task_prompt}创建一个数据看板,数据地址是:{data_file_path},数据信息是:{data_info},数据看板模板是:{dash_board_template}"+'./n数据看板代码要求及示例:'+dash_info_for_html
    result = dash_board_code_write_execute_agents(dash_board_info,workdir_,max_turns=7)
    return result
效果评估
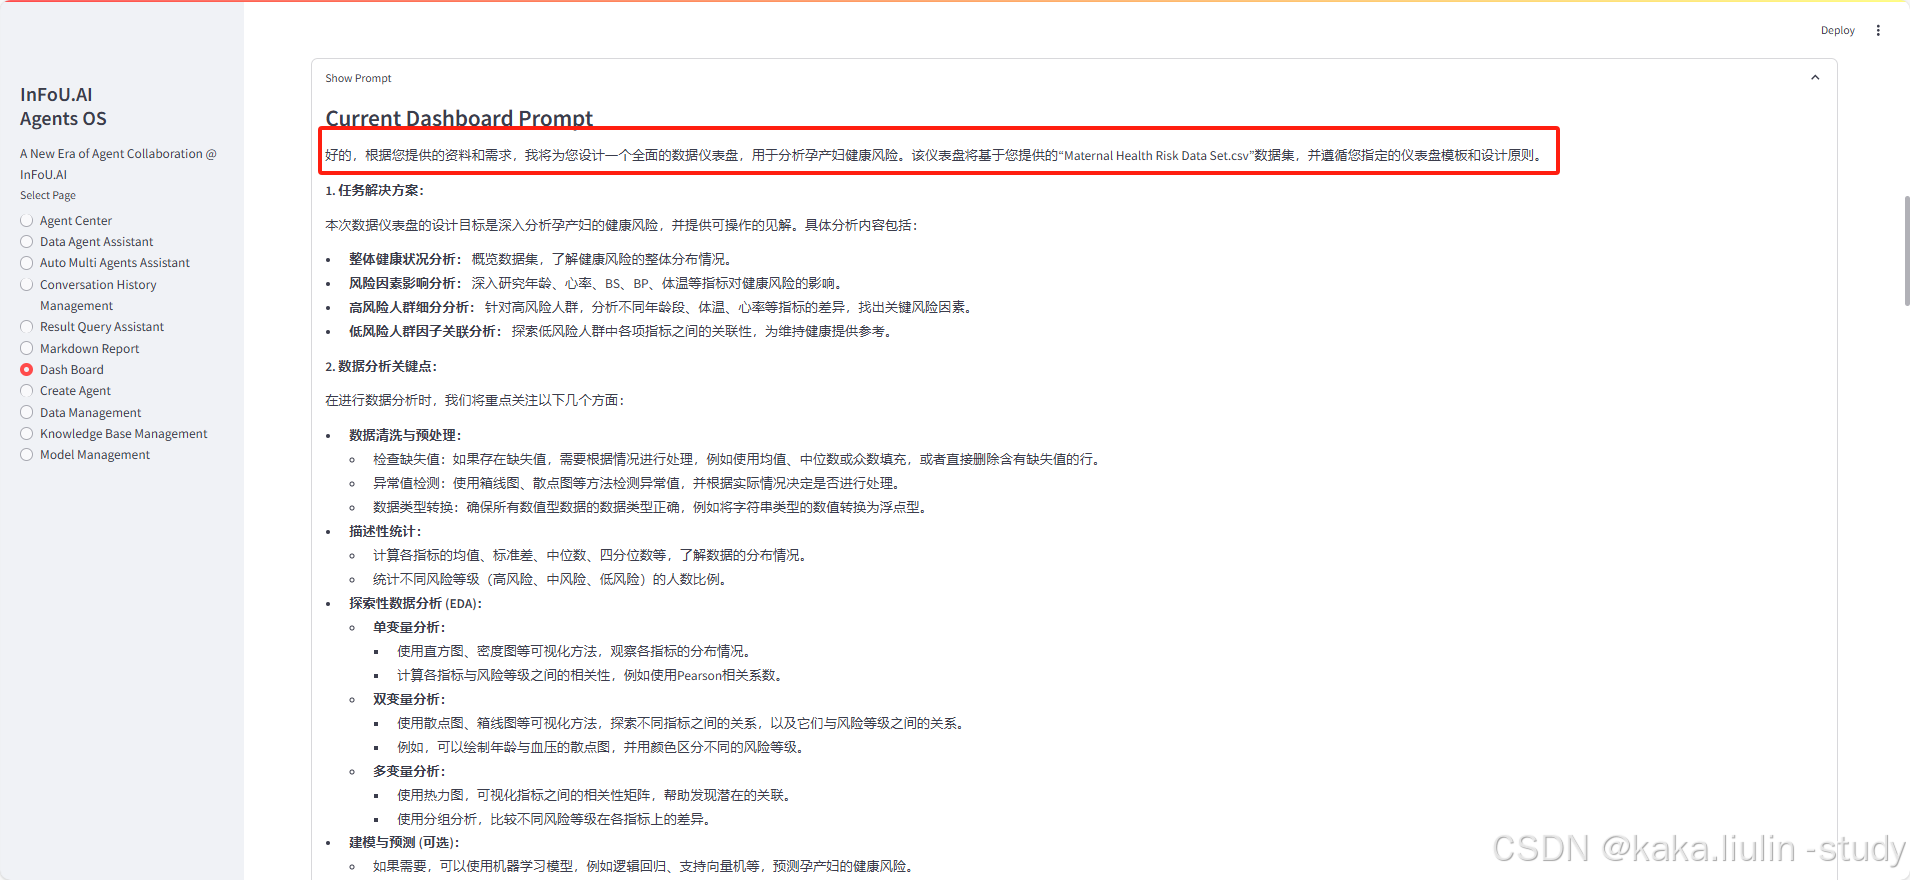
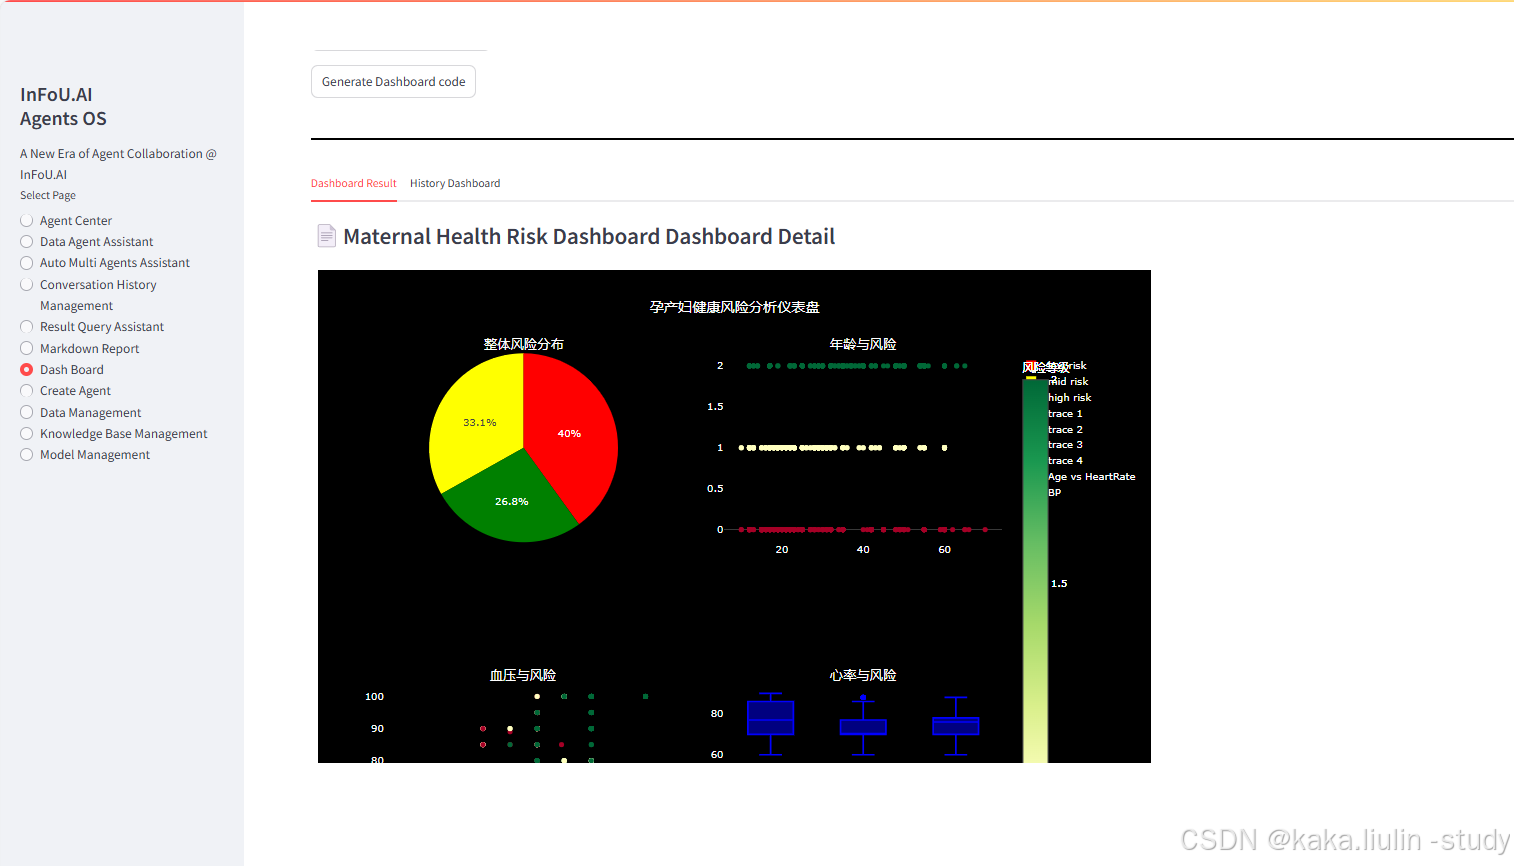
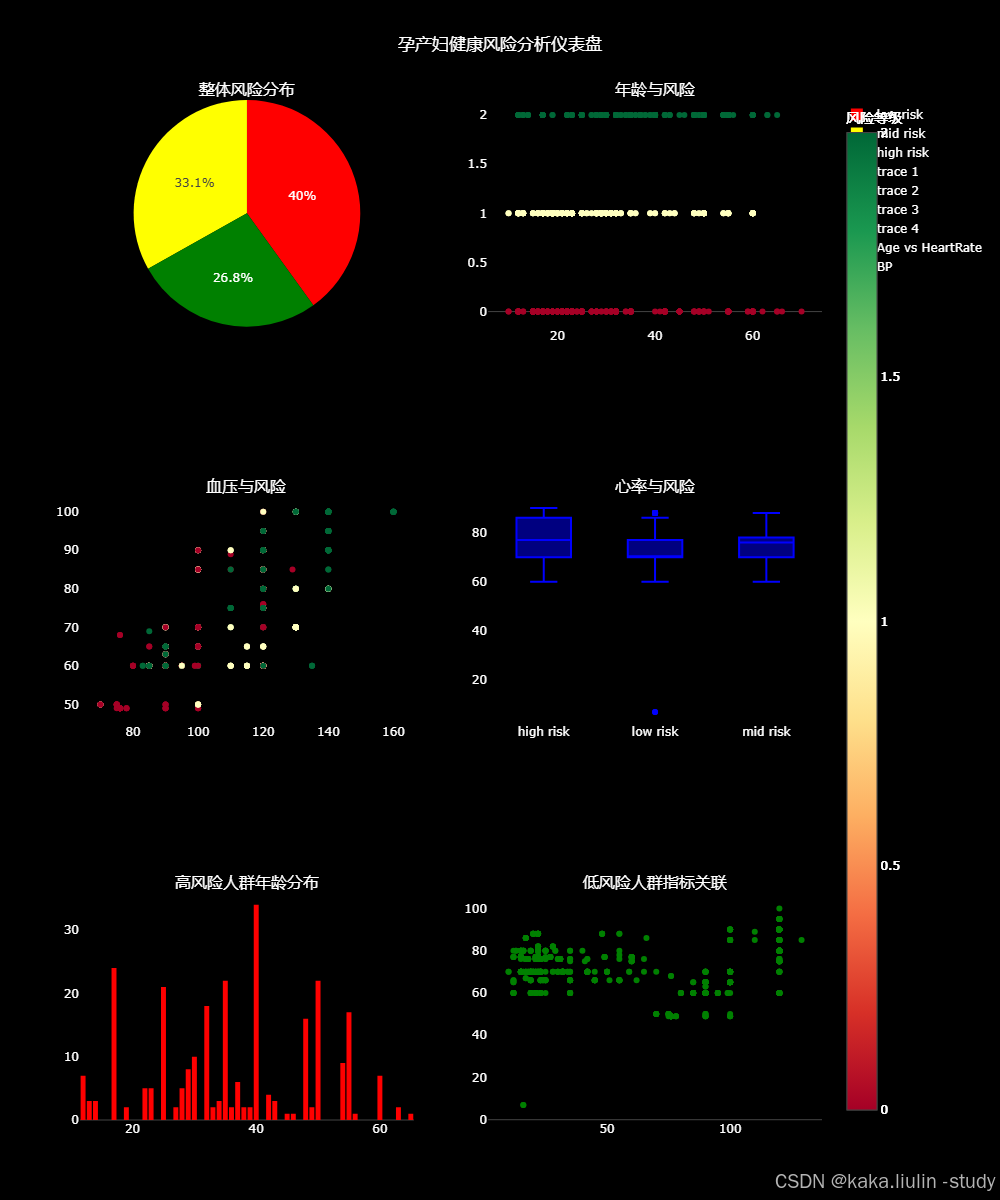
Task:分析健康状况的整体情况,深度分析:1、年龄、心率、BS、BP、体温等指标对健康风险的影响;2、分析高风险中年龄段、体温、心率等不同层次的影响;3、分析低风险中各项指标的因子关联情况。
- 生成的数据看板布局及数据分析建议:
- 生成的数据看板
总结
-
本博客的工作总结:通过基于大模型及多智能体的协作能力,探索了实时创建数据看板的可行性,并实践了无代码、低门槛的快速实现方案。这项工作显著降低了数据看板制作成本,为数据驱动决策提供了更高效和智能的工具支持。通过整合数据分析、可视化设计和交互功能,实现了实时动态数据的可视化展示,同时支持多场景应用。
-
多智能体协作及数据领域应用的设计要点:领域知识的加入是提升任务规划、任务执行及输出结果优化的关键;智能体之间的协作机制设计以及考虑引入专家经验辅助是提升协作质量和结果的可能路径。
-
目前的瓶颈及问题:
1)大模型的能力:对复杂领域知识的支持有限,对用户输入的模糊性和多样性处理仍需优化,大模型的上下文窗口限制了其在海量信息输入方面的发挥;
2)数据看板的丰富性:高级图表类型和复杂交互效果有限,动态讲述数据故事的能力有待加强。
3)复杂数据及复杂任务的局限:对数据分布广泛或高度动态的数据支持尚不完善,在处理多维度、多层级复杂任务时仍表现不足,在大模型能力、领域知识、数据预处理、智能体协作等方面需要更加完善的考虑。


 被折叠的 条评论
为什么被折叠?
被折叠的 条评论
为什么被折叠?
 到【灌水乐园】发言


