


一、网页访问
import (
	"net/http"
	_ "net/http/pprof"
)
func main() {
	go pprof() //启动pprof
}
func pprof() {
	http.ListenAndServe(":6060", nil) //pprof 默认是6060端口
}
访问链接 :http://127.0.0.1:6060/debug/pprof/
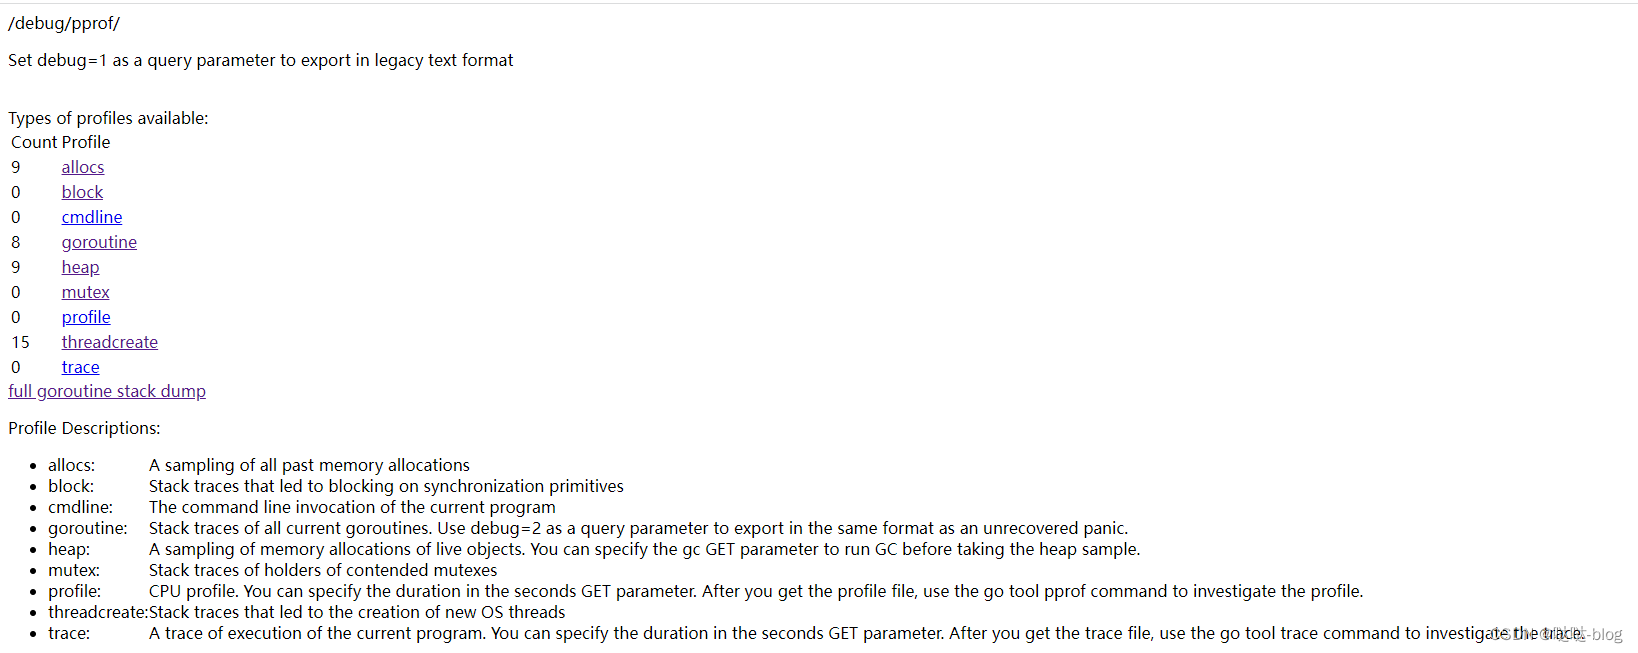
allocs:程序启动之后内存分配的情况
block:导致阻塞操作的一些堆栈跟踪信息
cmdline:当前程序启动的命令行
goroutine:所有当前 goroutine 的堆栈跟踪信息
heap:程序在当前堆上内存分配的情况
mutex:锁资源的竞争的堆栈信息
profile:CPU profile文件。可以在 debug/pprof?seconds=x秒 GET 参数中指定持续时间。获取pprof文件后,使用 go tool pprof x.prof命令分析pprof文件。
threadcreate:系统线程的使用情况
trace:当前系统的代码执行的链路情况
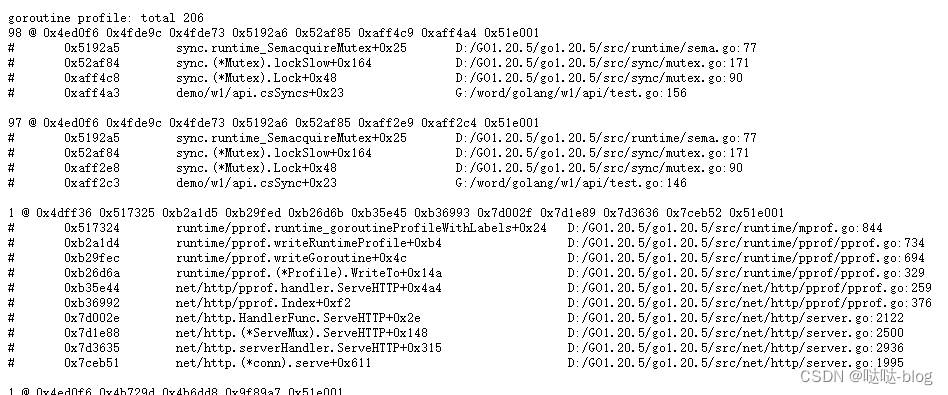
http://127.0.0.1:6060/debug/pprof/goroutine?debug=1
可以查看goroutine 数量,判断泄露位置
怎么使用pprof
pprof包含两个相关的库:
- runtime/pprof
主要应用于工具型应用。包含脚本、定时任务等。
如:对于只跑一次的程序,例如每天只跑一次的离线预处理程序,调用 pprof 包提供的函数,手动开启性能数据采集 - net/http/pprof
主要应用于服务型应用。包含HTTP服务,GRPC服务等。
如:对于在线服务,对于一个 HTTP Server,访问 pprof 提供的 HTTP 接口,获得性能数据。当然,实际上这里底层也是调用的 runtime/pprof提供的函数,封装成接口对外提供网络访问。
1、工具型
工具型应用主要使用 runtime/pprof 包实现性能分析。
package main

import (
	"bytes"
	"demo/pkg/fmtx"
	"flag"
	"math/rand"
	"os"
	"runtime"
	"runtime/pprof"
	"sync"
	"time"
)

var cpuprofile = flag.String("cpuprofile", "cpu.pprof", "write cpu profile to `file`")
var memprofile = flag.String("memprofile", "mem.pprof", "write mem profile to `file`")

func main() {
	fmtx.Println("w2")
	flag.Parse()
	if *cpuprofile != "" {
		f, err := os.Create(*cpuprofile)
		if err != nil {
			fmtx.Println("could not create CPU profile: ", err)
		}
		defer f.Close()

		if err := pprof.StartCPUProfile(f); err != nil {
			fmtx.Println("could not start CPU profile: ", err)
		}
		defer pprof.StopCPUProfile()
	}

	var wg sync.WaitGroup
	wg.Add(200)

	for i := 0; i < 200; i++ {
		go cyclenum(30000, &wg)
	}

	writeBytes()

	wg.Wait()

	if *memprofile != "" {
		f, err := os.Create(*memprofile)
		if err != nil {
			fmtx.Println("could not create memory profile: ", err)
		}
		defer f.Close()
		runtime.GC()

		if err := pprof.WriteHeapProfile(f); err != nil {
			fmtx.Println("cound not write memory profile: ", err)
		}
	}
	time.Sleep(2 * time.Second)
}

func cyclenum(num int, wg *sync.WaitGroup) {
	slice := make([]int, 0)
	for i := 0; i < num; i++ {
		for j := 0; j < num; j++ {
			j = i + j
			slice = append(slice, j)
		}
	}
	wg.Done()
}

func writeBytes() *bytes.Buffer {
	var buff bytes.Buffer

	for i := 0; i < 30000; i++ {
		buff.Write([]byte{'0' + byte(rand.Intn(10))})
	}
	return &buff
}
运行后可以看到两个文件
cpu.pprof
mem.pprof
执行命令 : go tool pprof .\cpu.pprof
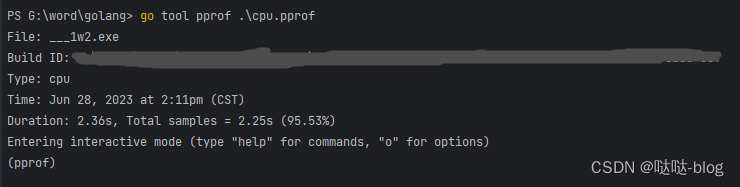
Type: 分析类型,这里是 cpu
Duration: 程序执行的时长
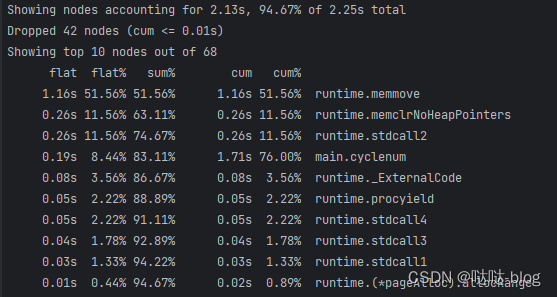
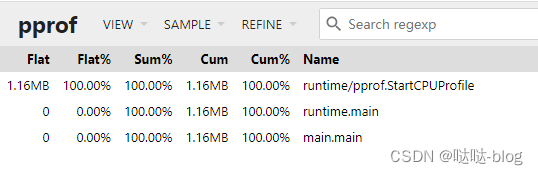
top 命令:对函数的 cpu 耗时和百分比排序后输出
| 字段 | 说明 |
|---|---|
| flat | 当前函数占用 cpu 耗时 |
| flat % | 当前函数占用 cpu 耗时百分比 |
| sum% | 函数占用 cpu 时间累积占比,从小到大一直累积到 100% |
| cum | 当前函数加上调用当前函数的函数占用 cpu 的总耗时 |
| %cum | 当前函数加上调用当前函数的函数占用 cpu 的总耗时占比 |
找到耗时函数后可以使用 list 逐行分析
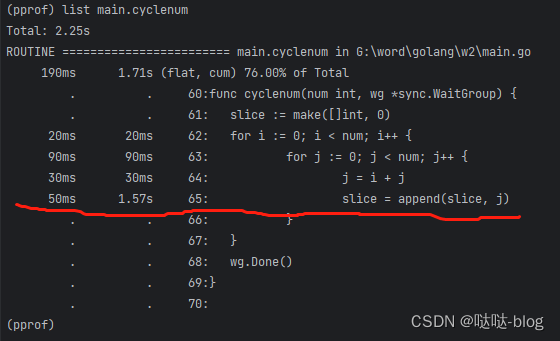
由此可以看出耗时原因是 slice 扩容,可以修改为固定容量
pprof 图形可视化
除了上面的命令行交互分析,还可以用图形化来分析程序性能。
图形化分析前,先要安装 graphviz 软件,
下载地址:graphviz地址,
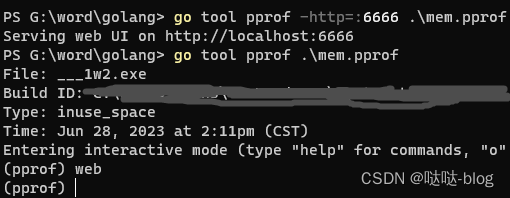
命令行输入:go tool pprof mem.pprof
输入 web 命令
生成svg:
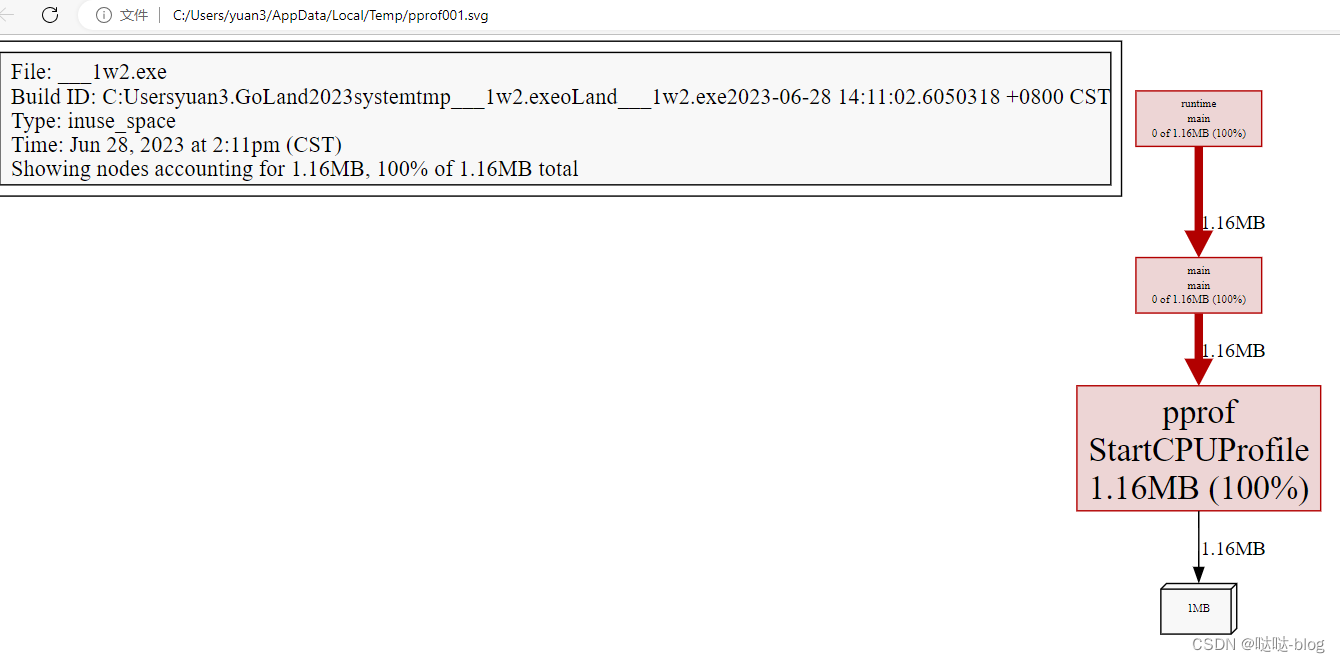
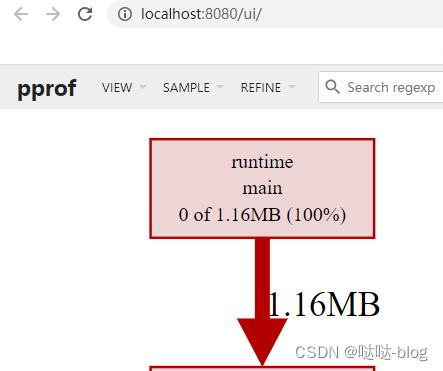
关于图形的一点说明:
- 每个框代表一个函数,理论上框越大表示占用的 cpu 资源越多
- 每个框之间的线条代表函数之间的调用关系,线条上的数字表示函数调用的次数
- 每个框中第一行数字表示当前函数占用 cpu 的百分比,第二行数字表示当前函数累计占用 cpu 的百分比
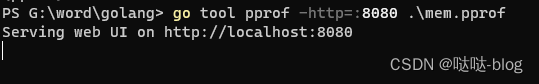
pprof 图形web可视化
运行命令:go tool pprof -http=:8080 mem.pprof
查看top
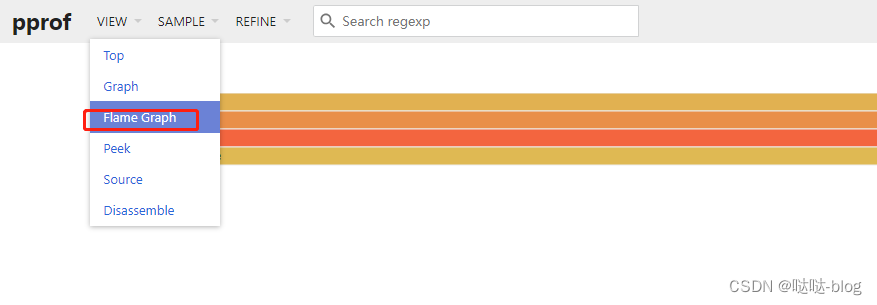
查火焰图


 802
802


 被折叠的 条评论
为什么被折叠?
被折叠的 条评论
为什么被折叠?
 到【灌水乐园】发言


