


活动发起人@小虚竹 想对你说:
这是一个以写作博客为目的的创作活动,旨在鼓励大学生博主们挖掘自己的创作潜能,展现自己的写作才华。如果你是一位热爱写作的、想要展现自己创作才华的小伙伴,那么,快来参加吧!我们一起发掘写作的魅力,书写出属于我们的故事。我们诚挚邀请你参加为期14天的创作挑战赛!
提醒:在发布作品前,请将不需要的内容删除。
一、二维图形
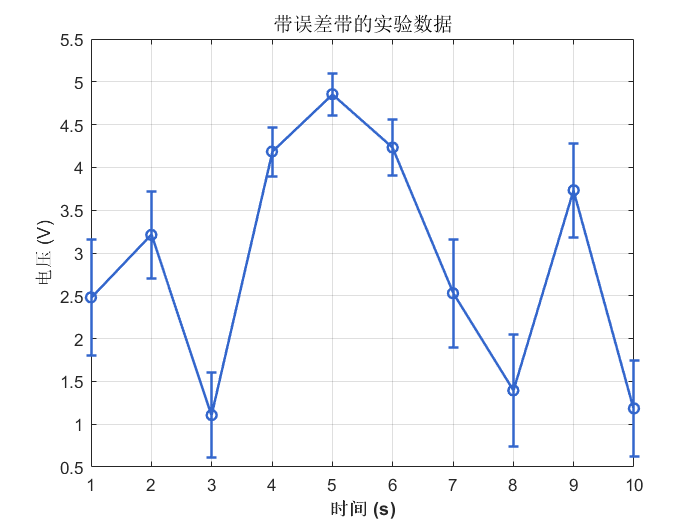
- 带误差带的折线图(论文常用)
% 数据准备
x = 1:10;
y = rand(1,10)*5;
err = 0.2 + rand(1,10)*0.5;

% 绘制误差折线图
errorbar(x, y, err, 'o-', 'LineWidth', 1.5, 'Color', [0.2 0.4 0.8])
 title('带误差带的实验数据','FontSize',12)
xlabel('时间 (s)','FontWeight','bold')
 ylabel('电压 (V)')
grid on
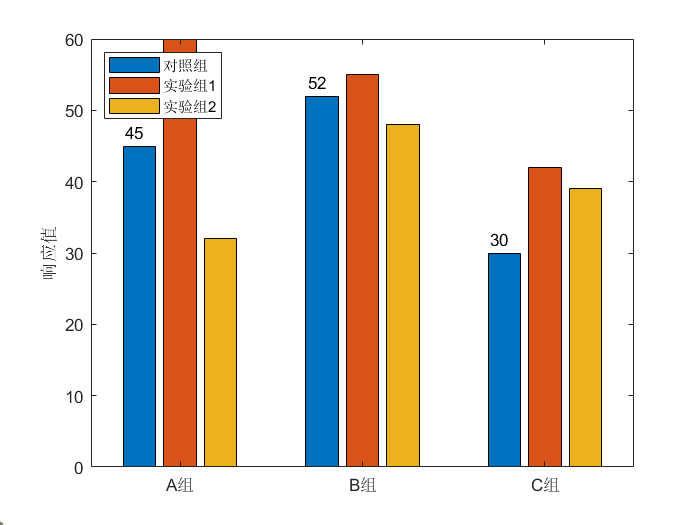
- 多数据对比柱状图
data = [45 60 32; 52 55 48; 30 42 39];  % 3组x3类别
 categories = {'A组', 'B组', 'C组'};

% 分组柱状图
bar(data, 'grouped')
set(gca, 'XTickLabel', categories)
legend({'对照组','实验组1','实验组2'}, 'Location', 'northwest')
ylabel('响应值')
% 添加数值标签
for i = 1:size(data,1)
   text(i-0.3, data(i,1)+2, num2str(data(i,1)), 'FontSize',10)
end
二、进阶二维技巧
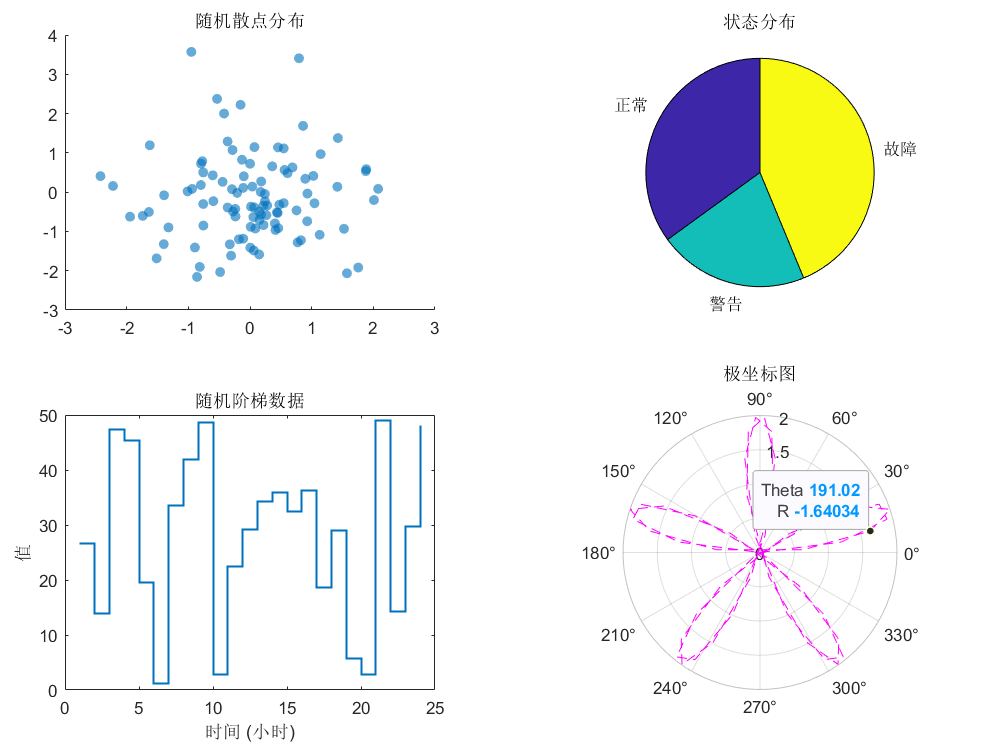
- 子图自动排版(适合多图对比)
figure('Position', [100 100 800 600]);  % 设置画布尺寸
tiledlayout(2, 2, 'Padding', 'compact');  % 创建2x2子图
% 子图1:散点图
nexttile;
scatter(randn(100, 1), randn(100, 1), 'filled', 'MarkerFaceAlpha', 0.6);
title('随机散点分布');
% 子图2:饼图
nexttile;
pie([28, 17, 35], {'正常', '警告', '故障'});
title('状态分布');
% 子图3:阶梯图
nexttile;
stairs(1:24, rand(24, 1) * 50, 'LineWidth', 1.2);
title('随机阶梯数据');
xlabel('时间 (小时)');
ylabel('值');
% 子图4:极坐标图
nexttile;
theta = linspace(0, 2*pi, 50);
polarplot(theta, 2*sin(5 * theta), 'm--');
title('极坐标图');
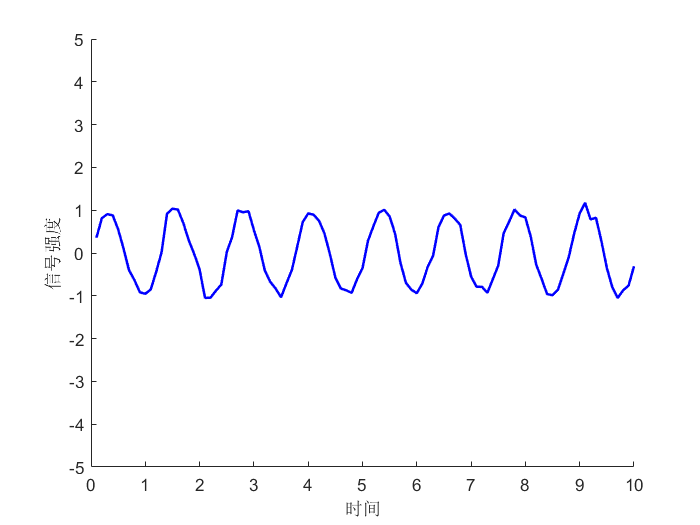
- 动态数据实时更新
h = animatedline('Color','b','LineWidth',1.5);
axis([0 10 -5 5])
xlabel('时间')
ylabel('信号强度')

for k = 1:100
    addpoints(h, k/10, sin(k/2)+0.1*randn())
    drawnow limitrate  % 高性能实时刷新
end
三、三维图形实战
- 三维曲线(轨迹可视化)
t = linspace(0, 10*pi, 500);
x = exp(-0.1*t).*sin(t);
y = exp(-0.1*t).*cos(t);
z = t/5;

plot3(x, y, z, 'LineWidth', 2)
view(45,30)  % 调整视角
xlabel('X轴'), ylabel('Y轴'), zlabel('Z轴')
grid on
box on  % 显示边框

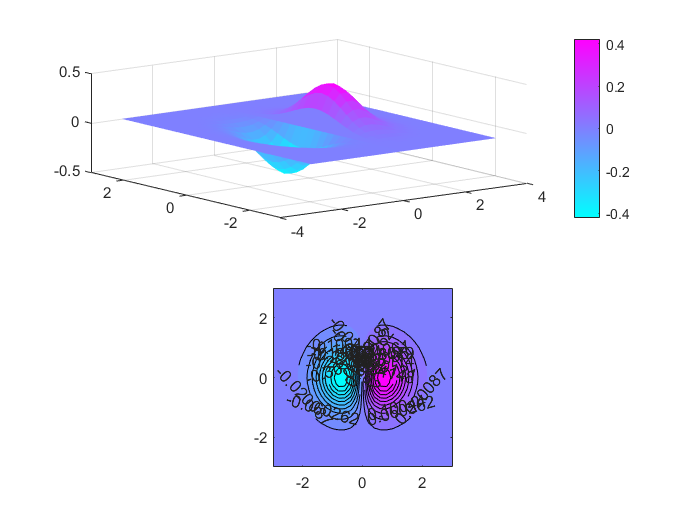
- 三维曲面+等高线
[X,Y] = meshgrid(-3:0.2:3);
Z = X.*exp(-X.^2 - Y.^2);

% 绘制三维曲面
subplot(2,1,1)
surf(X,Y,Z,'EdgeColor','none')
colormap(cool)  % 使用Turbo色谱
colorbar

% 叠加等高线投影
subplot(2,1,2)
contourf(X,Y,Z,20,'ShowText','on')
axis equal
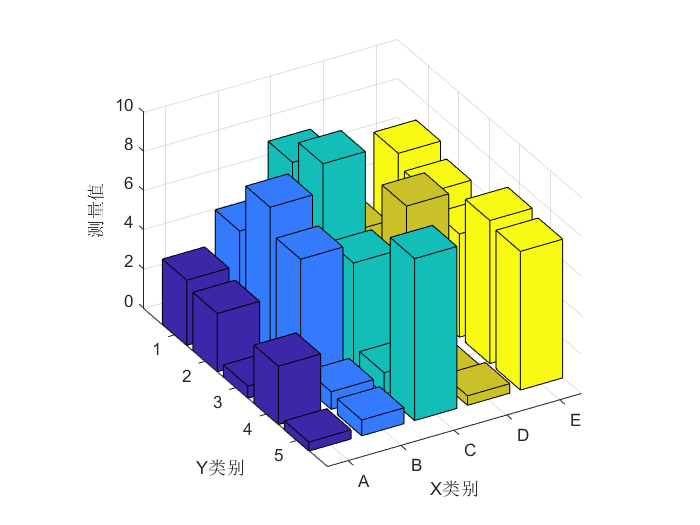
- 三维柱状图
% 生成3组三维坐标数据
x = repmat(1:5,5,1);
y = x';
z = rand(5,5)*10;

figure
bar3(z)
xlabel('X类别'), ylabel('Y类别'), zlabel('测量值')
set(gca,'XTickLabel',{'A','B','C','D','E'})
view(-30,30)  % 调整视角


 被折叠的 条评论
为什么被折叠?
被折叠的 条评论
为什么被折叠?
 到【灌水乐园】发言


