


 本文介绍了如何在3D图上叠加饼图,使用echarts库进行开发,包括依赖包安装、数据处理、3D参数方程计算以及与vue2的集成,同时提及了屏幕大小调整下的图表重绘功能。
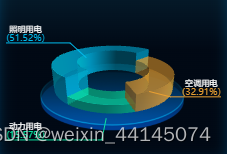
实现原理主要是在一个3D图上叠加一个饼图,饼图只保留引导线。
需要先下载echarts、echarts-gl依赖包
npm install echarts
npm install echarts-gl
其中,echarts需要时5.4.x版本以上的,不然样式显示会有影响。我现在用的5.4.3的最新版。
getPie3D(pieData, internalDiameterRatio) {
      let series = [];
      let sumValue = 0;
      let startValue = 0;
      let endValue = 0;
      let legendData = [];
      let k =
        typeof internalDiameterRatio !== "undefined"
          ? (1 - internalDiameterRatio) / (1 + internalDiameterRatio)
          : 1 / 3;

      // 为每一个饼图数据,生成一个 series-surface 配置
      for (let i = 0; i < pieData.length; i++) {
        sumValue += pieData[i].value;

        let seriesItem = {
          name:
            typeof pieData[i].name === "undefined"
              ? `series${i}`
              : pieData[i].name,
          type: "surface",
          parametric: true,
          wireframe: {
            show: false,
          },
          pieData: pieData[i],
          pieStatus: {
            selected: false,
            hovered: false,
            k: k,
          },
        };

        if (typeof pieData[i].itemStyle != "undefined") {
          let itemStyle = {};

          typeof pieData[i].itemStyle.color != "undefined"
            ? (itemStyle.color = pieData[i].itemStyle.color)
            : null;
          typeof pieData[i].itemStyle.opacity != "undefined"
            ? (itemStyle.opacity = pieData[i].itemStyle.opacity)
            : null;

          seriesItem.itemStyle = itemStyle;
        }
        series.push(seriesItem);
      }

      // 使用上一次遍历时,计算出的数据和 sumValue,调用 getParametricEquation 函数,
      // 向每个 series-surface 传入不同的参数方程 series-surface.parametricEquation,也就是实现每一个扇形。
      for (let i = 0; i < series.length; i++) {
        endValue = startValue + series[i].pieData.value;
        series[i].pieData.startRatio = startValue / sumValue;
        series[i].pieData.endRatio = endValue / sumValue;
        series[i].parametricEquation = this.getParametricEquation(
          series[i].pieData.startRatio,
          series[i].pieData.endRatio,
          false,
          false,
          k,
          series[i].pieData.value
        );

        startValue = endValue;

        legendData.push(series[i].name);
      }
      return series;
    },
    getParametricEquation(
      startRatio,
      endRatio,
      isSelected,
      isHovered,
      k,
      height
    ) {
      // 计算
      let midRatio = (startRatio + endRatio) / 2;

      let startRadian = startRatio * Math.PI * 2;
      let endRadian = endRatio * Math.PI * 2;
      let midRadian = midRatio * Math.PI * 2;

      // 如果只有一个扇形,则不实现选中效果。
      if (startRatio === 0 && endRatio === 1) {
        isSelected = false;
      }

      // 通过扇形内径/外径的值,换算出辅助参数 k(默认值 1/3)
      k = typeof k !== "undefined" ? k : 1 / 3;

      // 计算选中效果分别在 x 轴、y 轴方向上的位移(未选中,则位移均为 0)
      let offsetX = isSelected ? Math.cos(midRadian) * 0.1 : 0;
      let offsetY = isSelected ? Math.sin(midRadian) * 0.1 : 0;

      // 计算高亮效果的放大比例(未高亮,则比例为 1)
      let hoverRate = isHovered ? 1.05 : 1;

      // 返回曲面参数方程
      return {
        u: {
          min: -Math.PI,
          max: Math.PI * 3,
          step: Math.PI / 32,
        },

        v: {
          min: 0,
          max: Math.PI * 2,
          step: Math.PI / 20,
        },

        x: function (u, v) {
          if (u < startRadian) {
            return (
              offsetX +
              Math.cos(startRadian) * (1 + Math.cos(v) * k) * hoverRate
            );
          }
          if (u > endRadian) {
            return (
              offsetX + Math.cos(endRadian) * (1 + Math.cos(v) * k) * hoverRate
            );
          }
          return offsetX + Math.cos(u) * (1 + Math.cos(v) * k) * hoverRate;
        },

        y: function (u, v) {
          if (u < startRadian) {
            return (
              offsetY +
              Math.sin(startRadian) * (1 + Math.cos(v) * k) * hoverRate
            );
          }
          if (u > endRadian) {
            return (
              offsetY + Math.sin(endRadian) * (1 + Math.cos(v) * k) * hoverRate
            );
          }
          return offsetY + Math.sin(u) * (1 + Math.cos(v) * k) * hoverRate;
        },

        z: function (u, v) {
          if (u < -Math.PI * 0.5) {
            return Math.sin(u);
          }
          if (u > Math.PI * 2.5) {
            return Math.sin(u);
          }
          return Math.sin(v) > 0 ? 1 * height : -1;
        },
      };
    },
    cylinderEcharts(data) {
      this.cylinderChart = echarts.init(
        document.getElementById("itemize_echarts")
      );
      document
        .getElementById("itemize_echarts")
        .removeAttribute("_echarts_instance_");

      let color = ["#00BCEE", "#0BE19E", "#EAA031"];
      // 传入数据生成 option
      const optionsData = [...data];

      let options3D = [];
      data.forEach((m, mIndex) => {
        options3D.push({
          name: m.name,
          value: m.value,
          itemStyle: {
            opacity: 0.5,
            color: color[mIndex],
          },
        });
      });
      const series = this.getPie3D(options3D, 0.6);
      let widthValue = this.nowSize(378);

      series.push({
        name: "pie2d",
        type: "pie",
        label: {
          opacity: 1,
          edgeDistance: "1%",
          alignTo: "edge",
          distanceToLabelLine: 0,
          formatter: (params) => {
            return `{name|${params.name}}\n{${
              params.dataIndex == 0
                ? "red"
                : params.dataIndex == 1
                ? "blue"
                : "green"
            }|(${params.percent}%)}`;
          },
          color: "#fff",
          rich: {
            red: {
              fontSize: this.nowSize(16),
              color: "#00BCEE",
            },
            blue: {
              fontSize: this.nowSize(16),
              color: "#0BE19E",
            },
            green: {
              fontSize: this.nowSize(16),
              color: "#EAA031",
            },
            name: {
              fontSize: this.nowSize(14),
              color: "#fff",
              align: "center",
            },
          },
        },
        labelLine: {
          length: "10%",
          length2: 0,
        },
        labelLayout: function (params) {
          const isLeft = params.labelRect.x < widthValue / 2;
          const points = params.labelLinePoints;
          // Update the end point.
          points[2][0] = isLeft
            ? params.labelRect.x
            : params.labelRect.x + params.labelRect.width;
          return {
            labelLinePoints: points,
            verticalAlign: "bottom",
          };
        },
        startAngle: 45, //起始角度,支持范围[0, 360]。
        clockwise: false, //饼图的扇区是否是顺时针排布。上述这两项配置主要是为了对齐3d的样式
        radius: ["20%", "40%"],

        center: ["50%", "60%"],
        data: optionsData,
        itemStyle: {
          opacity: 0,
          color: (params) => {
            return color[params.dataIndex];
          },
        },
      });
      // 准备待返回的配置项,把准备好的 legendData、series 传入。
      let option = {
        grid: {
          top: "20%",
        },
        animation: true,
        xAxis3D: {
          min: -1,
          max: 1,
        },
        yAxis3D: {
          min: -1,
          max: 1,
        },
        zAxis3D: {
          min: -1,
          max: 1,
        },
        grid3D: {
          show: false,
          boxHeight: 0.1,
          // bottom: "20%",
          top: "10%",
          height: "100%",
          viewControl: {
            distance: 216,
            alpha: 24,
            beta: -45,
            autoRotate: false, // 自动旋转
            zoomSensitivity: 0,
            rotateSensitivity: 0,
            panSensitivity: 0,
          },
        },

        series: series,
      };

      option && this.cylinderChart.setOption(option, true);
    },
这个代码使用vue2写的,其中还有一个nowSize()函数是我写来做适配的,3280指的是屏宽或者是分辨率的宽;可以不调用这个函数,直接改为数值。
nowSize(val, initWidth = 3280) {
    var nowClientWidth = document.documentElement.clientWidth;
    return val * (nowClientWidth / initWidth);
},
在mounted中还加入了屏幕大小监听,屏幕大小变化时重新渲染图表使其大小跟随屏幕大小变化
mounted() {
window.onresize = () => {
this.cylinderChart && this.cylinderChart.resize();
};
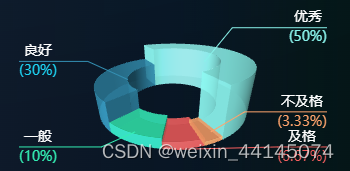
},或者修改修改参数,实现这样的样式(标签和数值被引导线分隔开),这个样式修改有问题的可以评论告诉我。


 151
151


 被折叠的 条评论
为什么被折叠?
被折叠的 条评论
为什么被折叠?
 到【灌水乐园】发言


