


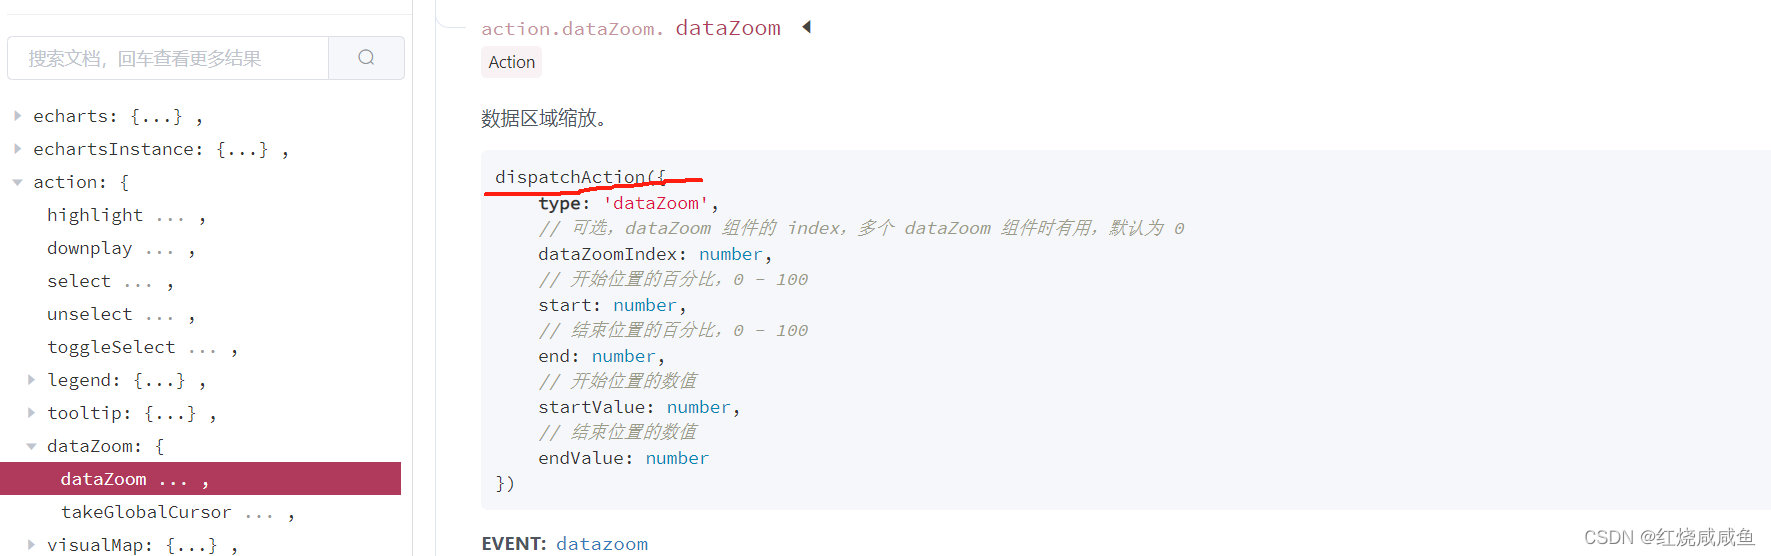
数据区域联动缩放需要用到 dataZoom 的专属事件 dispatchAction
实现多个数据区域联动缩放功能
<div style="width:100%;height:320px;" id="test01"></div>
<div style="width:100%;height:320px;" id="test02"></div>
<div style="width:100%;height:320px;" id="test03"></div>
let option = {
            title:{
              text:'测试'
            },
            tooltip: {
              trigger: 'axis',
              backgroundColor: 'rgba(17,21,43,0.75)',
              textStyle:{
                color:'#FFFFFF'
              },
              axisPointer: {
                type: 'cross'
              },
            },
            legend: {
              right:'5%',
              data: ['测试']
            },
            grid: {
              left: '2%',
              right: '4%',
              bottom: 50,
              containLabel: true
            },
            dataZoom: [
              {
                show: true,
                height: 20
              }
            ],
            xAxis: [
              {
                type: 'category',
                axisLine: { show: false },
                axisTick: { show: false },
                boundaryGap: ['20%', '20%'],
                data:[12,32,52,72,92]
              }
            ],
            yAxis: [
              {
                type: 'value',
                name: '测试',
                axisLine: { show: false },
                axisTick: { show: false }
              }
            ],
            series: [
              {
                name: '测试',
                type: 'line',
                symbol: 'circle',
                data: [12,13,43,56,78],
                xAxisIndex:0,
              }
             ]
          }
let test1 = echarts.init(document.getElementById('test01'));
let test2 = echarts.init(document.getElementById('test02'));
let test3 = echarts.init(document.getElementById('test03'));

option && test1.setOption(option);
option && test2.setOption(option);
option && test3.setOption(option);

this.linkageZoom(test1,[test2,test3])

linkageZoom(test1, arr){
	test1.on('datazoom', function(params) {
		arr.forEach(item => {
			item && item.dispatchAction({ // 触发 dataZoom 事件
				type: 'dataZoom',
				zoomLock: true, // 锁定整个图表的缩放功能
				xAxisIndex: params.xAxisIndex, // xAxisIndex 为当前操作的 xAxisIndex,用于确定对应的 xAxis 对象
				yAxisIndex: params.yAxisIndex, // yAxisIndex 为当前操作的 yAxisIndex,用于确定对应的 yAxis 对象
				start: params.start, // start 为当前操作的时间范围起始值
				end: params.end // end 为当前操作的时间范围结束值
			});
		})
	})
}
代码详解: test1的数据区域缩放改变后,会带动 test2,test3的数据区域缩放一起改变,并且 test2 test3的数据区域缩放可以单独拖动改变
echarts区域缩放相关链接: https://echarts.apache.org/zh/api.html#action.dataZoom.dataZoom


 951
951


 被折叠的 条评论
为什么被折叠?
被折叠的 条评论
为什么被折叠?
 到【灌水乐园】发言


