


1.向图中添加文本
此示例说明如何向图中添加文本、控制文本位置和大小以及创建多行文本。
1.1 文本位置
使用 text
函数在特定数据点旁边添加文本。在本例中,为点
(
π
, sin(
π
))
添加文本。
text 函数的前两个输入参数指定位置。第三个参数指定了文本。
默认情况下,text 支持一部分 TeX 标记。使用 TeX 标记 \pi
表示希腊字母 π。通过包含 TeX 标记\leftarrow,显示一个指向左侧的箭头。
x = linspace(0,10,50);
y = sin(x);
plot(x,y)
txt = '\leftarrow sin(\pi) = 0';
text(pi,sin(pi),txt)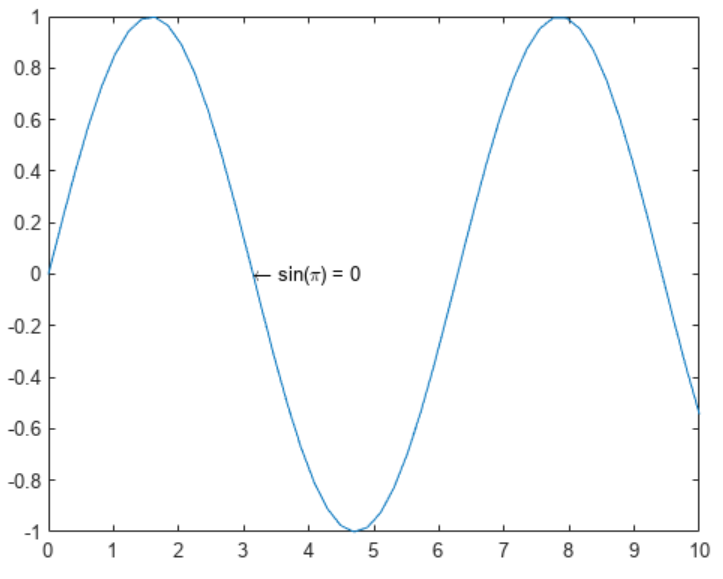
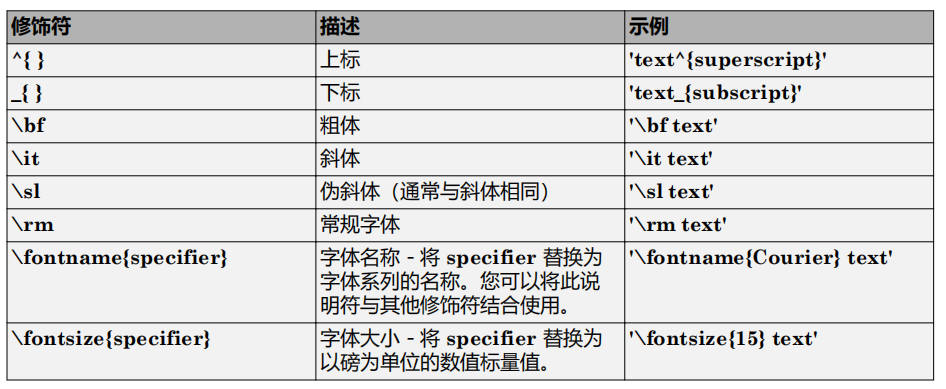
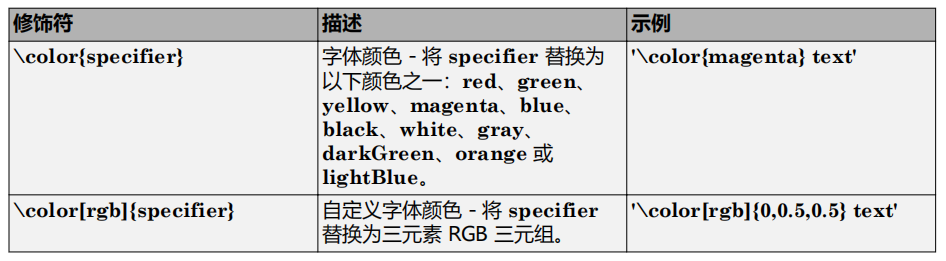
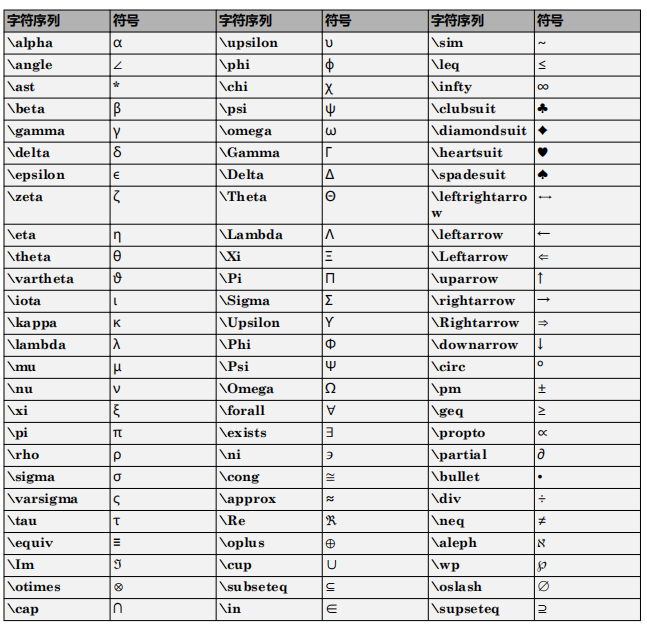
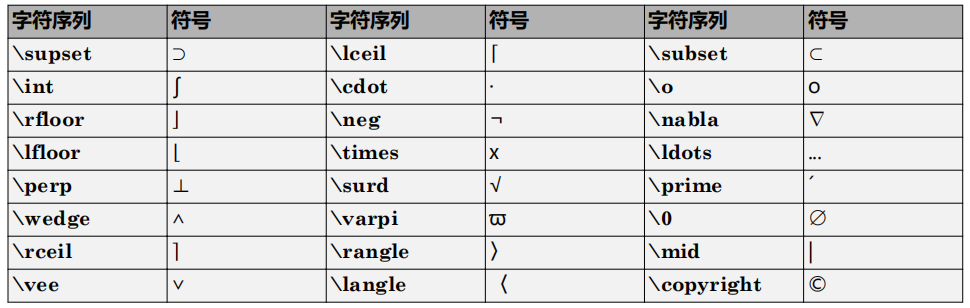
1.2 Maltab支持的TEX标记
Maltab支持的TEX标记
完整列表如下。
1.3 文本对齐方式
默认情况下,指定的数据点位于文本的左侧。通过将 HorizontalAlignment
属性指定为
'right',使数据点出现在文本右侧。使用指向右侧而不是左侧的箭头。
x = linspace(0,10,50);
y = sin(x);
plot(x,y)
txt = 'sin(\pi) = 0 \rightarrow';
text(pi,sin(pi),txt,'HorizontalAlignment','right')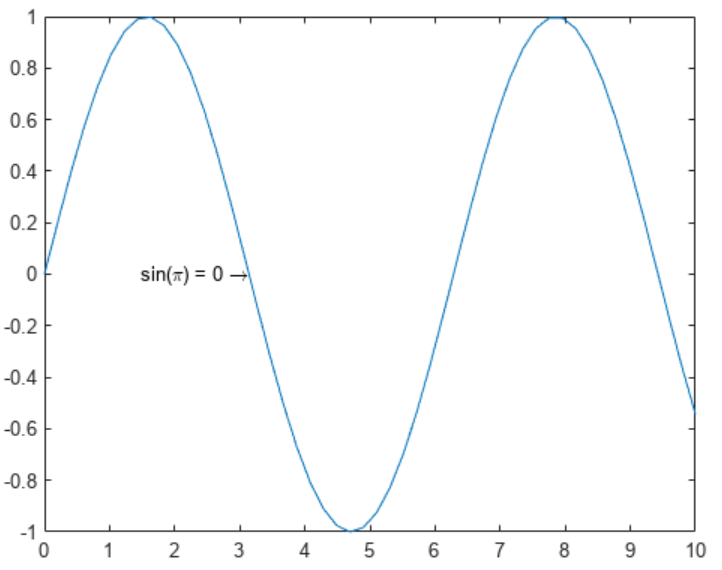
1.4 字体大小
通过将 FontSize
属性设置为
text
函数的名称-值对组参数,指定文本的字体大小。使用
title、xlabel
、
ylabel
或
legend
函数时,可以通过类似的方法更改字体大小。
x = linspace(0,10,50);
y = sin(x);
plot(x,y)
txt = '\leftarrow sin(\pi) = 0';
text(pi,sin(pi),txt,'FontSize',14)
1.5 设置文本属性
text 函数用于创建 Text 对象。Text
对象具有可用来自定义文本外观的属性,例如
HorizontalAlignment
或
FontSize
。
您可以通过两种方式设置属性:
• 在 text
命令中使用名称-值对组,例如
'FontSize',14
。
• 使用 Text
对象。您可以将
Text
对象作为
text
函数的输出参数返回,并将其赋给某个变量,例如
t。 然后,使用圆点表示法设置属性,例如
t.FontSize = 14
。
对于此示例,使用圆点表示法而不是名称-值对组来更改字体大小。
x = linspace(0,10,50);
y = sin(x);
plot(x,y)
txt = '\leftarrow sin(\pi) = 0';
t = text(pi,sin(pi),txt)
t =
Text (\leftarrow sin(\pi) = 0) with properties:
String: '\leftarrow sin(\pi) = 0'
FontSize: 10
FontWeight: 'normal'
FontName: 'Helvetica'
Color: [0 0 0]
HorizontalAlignment: 'left'
Position: [3.1416 1.2246e-16 0]
Units: 'data'
Show all properties
t.FontSize = 14;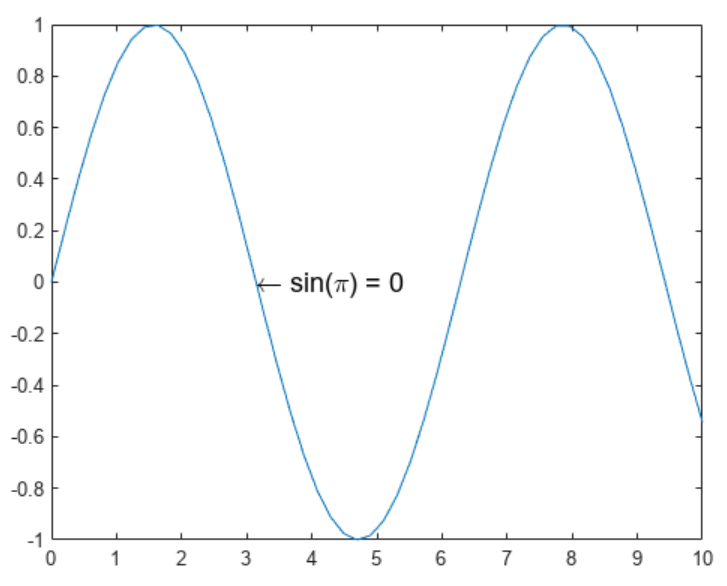
1.6 多行文本
使用字符向量元胞数组显示跨越多行的文本。元胞数组的每个元素代表一行文本。对于此示例,显示包含两行的标题。使用
title
、
xlabel
、
ylabel
或
legend
函数时,可以通过类似的方法显示多行文本。
x = linspace(0,10,50);
y = sin(x);
plot(x,y)
txt = {'Plotted Data:','y = sin(x)'};
text(4,0.5,txt)
1.7 带有变量值的文本
通过使用 num2str 函数将数字转换为文本,可在文本中包含变量值。对于此示例,计算均值 y 并在标题 中包含该值。使用
title
、
xlabel
、
ylabel
或
legend
函数时,可以通过类似的方法包含变量值。
x = linspace(0,10,50);
y = sin(x);
plot(x,y)
avg = mean(y);
txt = ['Average height: ' num2str(avg) ' units'];
text(4,0.5,txt)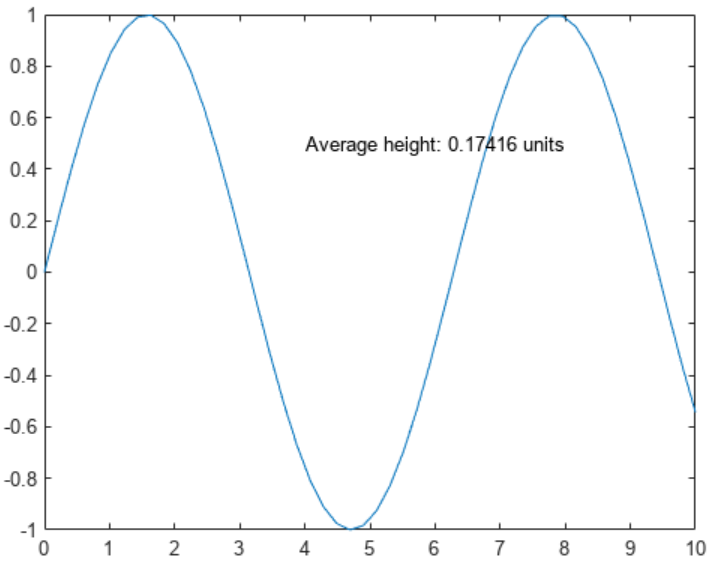
1.8 坐标区外部的文本
使用 annotation
函数而不是
text 函数,可在图窗内的任何位置添加文本。第一个输入参数指定注释的类型。第二个输入参数以归一化的图窗单位指定注释的位置。通过将
EdgeColor
属性设置为
'none',删除文本框边框。有关文本框注释的详细信息,请参阅
annotation
函数。
x = linspace(0,10,50);
y = sin(x);
plot(x,y)
annotation('textbox',[.9 .5 .1 .2], ...
'String','Text outside the axes','EdgeColor','none')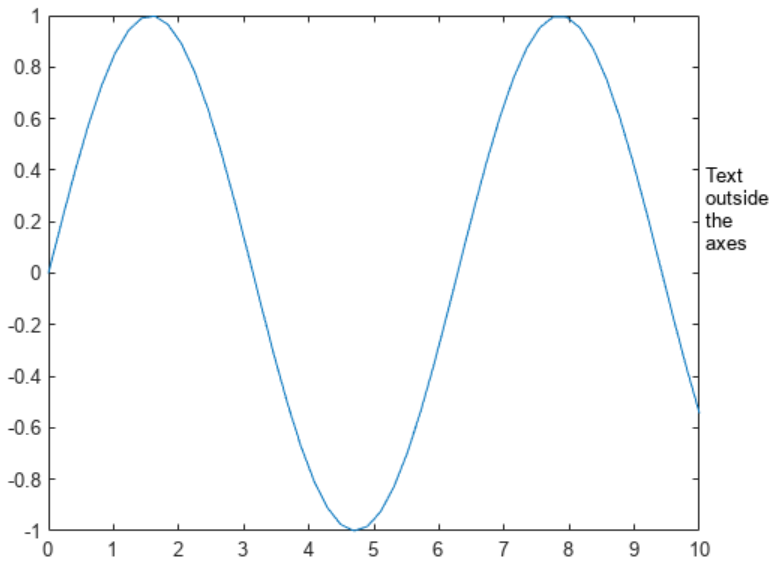
2.向图中添加注释
注释是添加到图中的额外信息,用来帮助标识一些重要信息。此示例首先解释不同类型的注释,然后说明如何向图中添加圆圈和文本箭头。
2.1 注释的类型
使用 annotation
函数可以向图中添加注释。函数的第一个输入指定要创建的注释的类型。
• 如果将类型指定为 'line'
、
'arrow'
、
'doublearrow'
或
'textarrow',则第二个输入是注释的起点和终点 x 位置。第三个输入是注释的起点和终点 y 位置。例如,
annotation('line',[x_begin x_end],
[y_begin y_end])
。
• 如果将类型指定为 'rectangle'
、
'ellipse'
或
'textbox',则第二个参数是位置和大小。例如,annotation('rectangle',[x y w h])
。
注释使用归一化的图窗单位,并且可以在一个图窗中跨越多个坐标区。
2.2 创建简单的图
定义和绘制函数 f(x)
和
g(x)
。
x = -3.0:0.01:3.0;
f = x.^2;
g = 5*sin(x) + 5;
figure
plot(x,f)
hold on
plot(x,g)
hold off
2.3 圆圈注释
在图中添加一个圆圈,以突出显示 f(x)
等于
g(x)
的位置。要创建圆圈,请使用
'ellipse' 选项作为注释类型。
通过设置底层对象的属性来自定义圆圈。将 Ellipse
对象作为
annotation 函数的输出参数返回。然后,使用圆点表示法访问对象的属性。例如,设置
Color
属性。
elps = annotation('ellipse',[.84 .68 .05 .05])
elps =
Ellipse with properties:
Color: [0 0 0]
FaceColor: 'none'
LineStyle: '-'
LineWidth: 0.5000
Position: [0.8400 0.6800 0.0500 0.0500]
Units: 'normalized'
Show all properties
elps.Color = [0 0.5 0.5];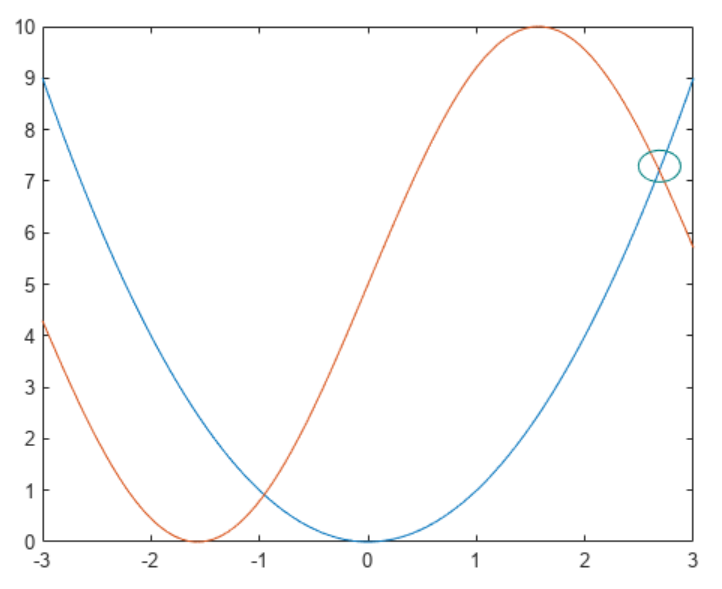
2.4 文本箭头注释
使用 'textarrow'
选项作为注释类型,向图中添加一个文本箭头。
您可以通过设置底层对象的属性来自定义文本箭头。将 TextArrow
对象作为
annotation 函数的输出参数返回。然后,使用圆点表示法访问对象的属性。例如,将
String
属性设置为所需的文本,将
Color 属性设置为颜色值。
ta = annotation('textarrow', [0.76 0.83], [0.71 0.71])
ta =
TextArrow with properties:
String: {''}
FontName: 'Helvetica'
FontSize: 10
Color: [0 0 0]
TextColor: [0 0 0]
LineStyle: '-'
LineWidth: 0.5000
HeadStyle: 'vback2'
Position: [0.7600 0.7100 0.0700 0]
Units: 'normalized'
X: [0.7600 0.8300]
Y: [0.7100 0.7100]
Show all properties
ta.String = 'f(x) = g(x) ';
ta.Color = [0 0.5 0.5];


 1407
1407


 被折叠的 条评论
为什么被折叠?
被折叠的 条评论
为什么被折叠?
 到【灌水乐园】发言


