<template>
<div class="echart5" ref="mychart5" id="mychart5" :style="myChartStyle5"></div>
</template>
data() {
return {
myChartStyle5: { float: "left", width: "100%", height: "450px" }, //图表样式
isActivated:0,
productStatus1:0,
productStatus2:0,
productStatus3:0,
productStatus4:0,
productStatus5:0,
productStatus6:0,
kind1:0,
kind2:0,
kind3:0,
kind4:0,
kind5:0,
kind6:0,
kind7:0,
}
},
activated(){
if(!this.isActivated){
this.isActivated = true
this.underRight();
window.addEventListener("resize", () => { this.handleResize()})
}
window.dispatchEvent(new Event('resize'))
},
beforeDestroy() {
window.removeEventListener('resize', this.handleResize());
},
methods: {
handleResize(){
this.myChart5 = echarts.init(this.$refs.mychart5);
this.myChart5.resize();
},
underRight(){
HTZXTZProductStatus().then( res=>{
const result = res.result
debugger
for(var i=0; i< result.length;i++){
this.productStatus1= result[0].productStatus1
this.productStatus2= result[0].productStatus2
this.productStatus3= result[0].productStatus3
this.productStatus4= result[0].productStatus4
this.productStatus5= result[0].productStatus5
this.productStatus6= result[0].productStatus6
this.kind1=result[0].kind1
this.kind2=result[0].kind2
this.kind3=result[0].kind3
this.kind4=result[0].kind5
this.kind5=result[0].kind5
this.kind6=result[0].kind6
this.kind7=result[0].kind7
}
const option5 = {
tooltip:{
trigger :"item",
},
label: {
show: true, // 显示标签
position: 'inside', // 在饼图内部显示标签
formatter: '{b}:{d}%'
},
legend: {
orient: 'vertical',
height: 200,
x: 'left',
y: 'bottom',
itemGap:3,
icon: 'circle',
align: 'left',
itemWidth:2,
//borderColor: black,
formatter: function (name) {
var total = 0;
var data;
option5.series.forEach(function (series) {
data = series.data.find(function (item) {
return item.name === name;
});
total += data ? data.value : 0;
});
return name +":"+ total;
},
},
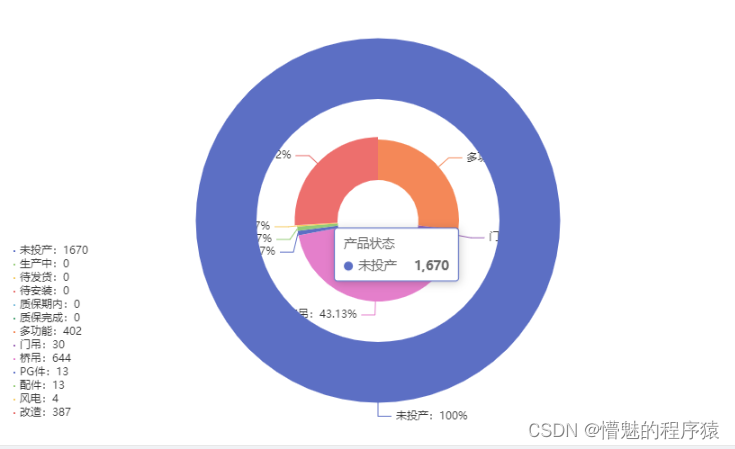
series: [
{
name: '产品状态',
type: 'pie',
radius: ['60%', '90%'], // 设置饼图的内外半径,实现环形效果
data: [
{ value: this.productStatus1, name: '未投产' },
{ value: this.productStatus2, name: '生产中' },
{ value: this.productStatus3, name: '待发货' },
{ value: this.productStatus4, name: '待安装' },
{ value: this.productStatus5, name: '质保期内' },
{ value: this.productStatus6, name: '质保完成' },
]
},
{
name: '产品类别',
type: 'pie',
radius: ['20%', '40%'], // 设置饼图2的内外半径,调整大小关系
data: [
{ value: this.kind1, name: '多功能' },
{ value: this.kind2, name: '门吊' },
{ value: this.kind3, name: '桥吊' },
{ value: this.kind4, name: 'PG件' },
{ value: this.kind5, name: '配件' },
{ value: this.kind6, name: '风电' },
{ value: this.kind7, name: '改造' },
]
}
]
};
const myChart5 = echarts.init(document.getElementById("mychart5"));
myChart5.setOption(option5);
})
},
}


 1万+
1万+

 被折叠的 条评论
为什么被折叠?
被折叠的 条评论
为什么被折叠?
 到【灌水乐园】发言


