


python 如何在地图上绘制矩形框
通过官网的一些示例,对于处理海洋上的数据时,在地图上绘制矩形框,只需要增加一下投影,然后根据经纬度设置你的范围即可。
matplotlib.patches.Rectangle官网说明
matplotlib.patches.Rectangle(xy, width, height, angle=0.0, **kwargs)[source]
从函数可以看出来,主要就是设置(起始点,宽,高),所谓的起始点就是从左下角开始绘图的点,投影到地图上就是我们的(经度第一个值,纬度第一个值),宽度和高度就简单了,选取的经度范围和纬度范围罢了。下面这个图可以很形象的表示出来:
:                +------------------+
:                |                  |
:               lat                 |
:                |                  |
:     (lon[0],lat[0])---- lon -----+
首先导入所需的包:
import xarray as xr
import numpy as np
import matplotlib.pyplot as plt
import cartopy.feature as cfeature
from cartopy.mpl.ticker import LongitudeFormatter, LatitudeFormatter
import cartopy.crs as ccrs
from matplotlib.patches import Rectangle
然后,随便导入你要进行绘制的数据经纬度,我这里使用的是SST(海表温度):
path='D:\\sst.nc'
ds=xr.open_dataset(path).sortby("lat", ascending= True)
sst=ds.sel(lat=slice(-20,20),time=slice('2000','2010'))
# 选择矩形框的区域,矩形框的经纬度范围
region=sst.sel(lat=slice(-15,15),lon=slice(180,180+90)).sst
lon=region.lon.data
lat=region.lat.data
#定义一个绘图函数,避免以后绘制多张图时,重复输入代码
def make_map(ax, title):
# set_extent set crs
ax.set_extent(box, crs=ccrs.PlateCarree())
land = cfeature.NaturalEarthFeature('physical',
'land',
scale,
edgecolor='grey',
facecolor='grey',
zorder=2)
ax.add_feature(land) # set land color
ax.coastlines(scale) # set coastline resolution
# set coordinate axis
ax.set_xticks(np.arange(0, 360+45, 45),crs=ccrs.PlateCarree())
ax.set_yticks(np.arange(-20, 30, 10),crs=ccrs.PlateCarree())
ax.xaxis.set_major_formatter(LongitudeFormatter(zero_direction_label =False))#经度0不加标识
ax.yaxis.set_major_formatter(LatitudeFormatter())
# plt.tick_params(labelsize=25)
lon_formatter = LongitudeFormatter(zero_direction_label=False)
# zero_direction_label set 0 without E or W
lat_formatter = LatitudeFormatter()
ax.xaxis.set_major_formatter(lon_formatter)
ax.yaxis.set_major_formatter(lat_formatter)
ax.set_title(title, fontsize=25, loc='center')
ax.tick_params(which='major',
direction='out',
length=8,
width=0.99,
pad=0.2,
labelsize=20,
bottom=True, left=True, right=False, top=False)
return ax
# 设置绘图函数所需的参数
box = [0, 361, -20, 20]
scale = '50m'
xstep, ystep = 45, 10
cmap=plt.get_cmap('jet',9)#'RdYlBu_r' 'viridis'
proj=ccrs.PlateCarree(central_longitude=180)
box_top = 45
#设置矩形框的起始点
start_point = (lon[0], lat[0])
# 进行绘图
# # #===============================开始绘图==============================
fig=plt.figure(figsize=(20,12))
ax= fig.add_axes([0.1, 0.2, 0.5, 0.5],projection = proj)
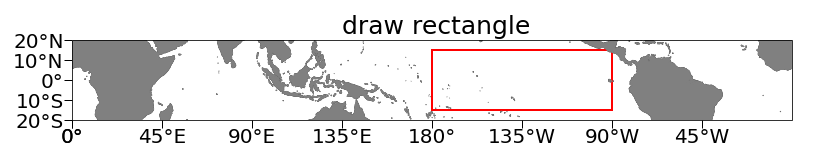
make_map(ax,' draw rectangle')
# # # select 矩形区域
RE=Rectangle(start_point,lon[-1]-lon[0],lat[-1]-lat[0],linewidth=2,linestyle='-' ,zorder=2,\
edgecolor='red',facecolor='none', transform=ccrs.PlateCarree()) #25表示纬度间隔25
ax.add_patch(RE) #添加矩形框,如果这一句求掉了就没有框显示了
运行一下代码可以发现绘制成功啦~~非常简单
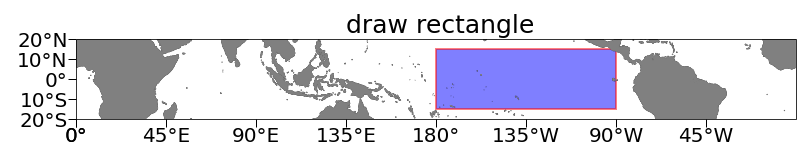
#当然,你可以进行下面的操作,使框内增加颜色
re=Rectangle(start_point,lon[-1]-lon[0],lat[-1]-lat[0],linewidth=2,linestyle='-' ,zorder=2,\
              edgecolor='red',facecolor='blue',alpha=0.5, transform=ccrs.PlateCarree())
ax.add_patch(re)
ok,that’s all。
感兴趣的小伙伴们可以尝试。
										    		一个努力学习python的海洋菜鸡
										                 水平有限,欢迎指正!!!
										              欢迎关注、点赞、评论、收藏。


 2640
2640


 被折叠的 条评论
为什么被折叠?
被折叠的 条评论
为什么被折叠?
 到【灌水乐园】发言


