


GDB 学习笔记
目录
简介
官网:https://www.gnu.org/software/gdb
GDB(GNU Debug),是unix及unix like下的调试工具,后也被移植到Windows平台。GDB所有操作均在终端中执行,接收终端的命令来调试程序。GDB支持众多语言的调试,比如C、C++ 、Python、Java、GO、Asm等。本文以C为示例讲解
环境搭建
查看gdb是否已安装
$ gdb -v
GNU gdb (Ubuntu 9.2-0ubuntu1~20.04) 9.2
Copyright (C) 2020 Free Software Foundation, Inc.
License GPLv3+: GNU GPL version 3 or later <http://gnu.org/licenses/gpl.html>
This is free software: you are free to change and redistribute it.
There is NO WARRANTY, to the extent permitted by law.
安装教程省略
常用操作
1.编译
main.c 代码如下:
#include "stdio.h"
#include "stdlib.h"
#include "string.h"

typedef struct m{
    int a;
    int b;
    int result;
}m_t;

void fun(m_t * m)
{
    m->result = m->a + m->b;
}

int main(int argc, char *argv[])
{
    m_t test;

    if (argc > 1)
    {
        printf("%s \n", argv[1]);
    }

    test.a = 1;
    test.b = 2;
    fun(&test);
    printf("result = %d", test.result);


}
要调试c/c++目标代码,必须加载对应可执行文件,即*.o。因此需要先编译生成对应可执行文件。使用gcc命令进行编译时,必须使用 "-g"参数来生成调试信息,否则无法调试。指令如下:
$ gcc -g main.c -o main
2.启动与退出调试
命令行终端键入 ‘gdb’ 回车,则直接在当前目录启动gdb调试,启动后加载指定可执行文件
$ gdb
$ file main
也可以指定文件启动 gdb
$ gdb main
调试完毕后,可以输入 quit 或 Ctrl + D 退出调试
$ gdb
GNU gdb (Ubuntu 9.2-0ubuntu1~20.04) 9.2
Copyright (C) 2020 Free Software Foundation, Inc.
License GPLv3+: GNU GPL version 3 or later <http://gnu.org/licenses/gpl.html>
This is free software: you are free to change and redistribute it.
There is NO WARRANTY, to the extent permitted by law.
Type "show copying" and "show warranty" for details.
This GDB was configured as "x86_64-linux-gnu".
Type "show configuration" for configuration details.
For bug reporting instructions, please see:
<http://www.gnu.org/software/gdb/bugs/>.
Find the GDB manual and other documentation resources online at:
    <http://www.gnu.org/software/gdb/documentation/>.
    For help, type "help".
Type "apropos word" to search for commands related to "word".
(gdb) file main
Reading symbols from main...
(gdb) quit
qyue@zk-etxyxu068:~/code/test
$
qyue@zk-etxyxu068:~/code/test
$ gdb main
GNU gdb (Ubuntu 9.2-0ubuntu1~20.04) 9.2
Copyright (C) 2020 Free Software Foundation, Inc.
License GPLv3+: GNU GPL version 3 or later <http://gnu.org/licenses/gpl.html>
This is free software: you are free to change and redistribute it.
There is NO WARRANTY, to the extent permitted by law.
Type "show copying" and "show warranty" for details.
This GDB was configured as "x86_64-linux-gnu".
Type "show configuration" for configuration details.
For bug reporting instructions, please see:
<http://www.gnu.org/software/gdb/bugs/>.
Find the GDB manual and other documentation resources online at:
    <http://www.gnu.org/software/gdb/documentation/>.
    For help, type "help".
Type "apropos word" to search for commands related to "word".
Reading symbols from main...
(gdb)
如果出现No debugging symbols found,表示找不到调试信息,可能编译的可执行文件没有不带有调试信息。请尝试带“-g” 参数重新编译
(gdb) file main
Reading symbols from main...
(No debugging symbols found in main)
3.运行
命令行键入 “run” (也可以直接输入 “r”)即开始运行程序,直至断点或程序退出
(gdb) run
Starting program: ~/code/test/main
result = 3
[Inferior 1 (process 1141308) exited normally]
代码中可看出该程序可传入参数,上述指令不带任何参数运行,要带参数运行程序只需要在run 后面跟上参数就行了
(gdb) r test
Starting program: ~/code/test/main test
test
result = 3
[Inferior 1 (process 1142049) exited normally]
注:默认argc = 1,有参数时会大于1。
4.常用调试指令
4.1 断点 (breakpoints)
4.1.1 设置断点(break)
设置断点,是常用调试手段之一,可以在程序断点处暂停下来,以方便查看内存、变量以及堆栈,“break”可以简写为 “b”
break file:line # 在在指定行或指定文件某行设置断点
# file 为指定文件,可能没有
# line 为行号
break func # 在函数的入口处设置断点,func为指定函数
tbreak line / func # 设置临时断点,当运行到断点处时,自动删除断点。简记 ‘tb’
设置断点之后,每个断点会有一个断点编号,如下:
(gdb) break main.c:27
Breakpoint 1 at 0x5555555551e3: file main.c, line 27.
(gdb) b fun
Breakpoint 2 at 0x555555555169: file main.c, line 12.
4.1.2 查看断点(info)
info b # 显示当前所有节点信息
4.1.3 删除断点(delete / clear)
delete num # 删除指定编号的断点,num为上述设置断点的编号,可通过指令查看当前断点情况
clear line # 清除指定行的断点,line 为断点行号
delete breakpoints # 删除所有断点
4.1.4 禁用与使能断点(enable / disable)
enable num # 使能指定编号的断点,num为上述设置断点的编号
disable num # 禁用指定编号的断点,num为上述设置断点的编号
4.2 查看源码(list)
list 简记为‘l’,可查看源码,每次显示10行。list line指令会显示以行号为line的一行为中心的前后共10行代码
(gdb) l main.c:22
17      {
18          m_t test;
19
20          if (argc > 1)
21          {
22              printf("%s \n", argv[1]);
23          }
24
25          test.a = 1;
26          test.b = 2;
(gdb)
4.3 观察点(watch)
当我们需要查看某个变量在某个程序执行过程中的变化时,可以对变量设置观察点。在后续的进入式(会进入到所调用的子函数中)单步执行(step)或非进入式(不会进入到所调用的子函数中)单步执行(next)中,遇到观察的变量发生变化时,命令行会显示出变化前后的值。调试过程如下
(gdb) l 32
27          fun(&test);
28          printf("result = %d", test.result);
29
30          for (int i = 0; i < 5; i++)
31          {
32              test.result += test.a;
33          }
34      }
(gdb) b main.c:30
Breakpoint 1 at 0x1205: file main.c, line 30.
(gdb) r
Starting program: /remote/cswg01/users/qyue/code/test_code/main

Breakpoint 1, main (argc=1, argv=0x7fffffffd0a8) at main.c:30
30          for (int i = 0; i < 5; i++)
(gdb) watch test
Hardware watchpoint 2: test
(gdb) s
32              test.result += test.a;
(gdb) s

Hardware watchpoint 2: test

Old value = {a = 1, b = 2, result = 3}
New value = {a = 1, b = 2, result = 4}
main (argc=1, argv=0x7fffffffd0a8) at main.c:30
30          for (int i = 0; i < 5; i++)
(gdb) n
32              test.result += test.a;
(gdb) n

Hardware watchpoint 2: test
Old value = {a = 1, b = 2, result = 4}
New value = {a = 1, b = 2, result = 5}
main (argc=1, argv=0x7fffffffd0a8) at main.c:30
30          for (int i = 0; i < 5; i++)
(gdb) c
Continuing.

Hardware watchpoint 2: test

Old value = {a = 1, b = 2, result = 5}
New value = {a = 1, b = 2, result = 6}
main (argc=1, argv=0x7fffffffd0a8) at main.c:30
30          for (int i = 0; i < 5; i++)
(gdb) c
Continuing.

Hardware watchpoint 2: test

Old value = {a = 1, b = 2, result = 6}
New value = {a = 1, b = 2, result = 7}
main (argc=1, argv=0x7fffffffd0a8) at main.c:30
30          for (int i = 0; i < 5; i++)
(gdb) c
Continuing.

Hardware watchpoint 2: test
Old value = {a = 1, b = 2, result = 7}
New value = {a = 1, b = 2, result = 8}
main (argc=1, argv=0x7fffffffd0a8) at main.c:30
30          for (int i = 0; i < 5; i++)
watch 还有一些拓展指令:
awatch:设置内存观察点,当发生读写时都会停止
rwatch:设置读出观察点
观察点的操作和断点类似,都可以使用delete删除,info查看,enable/disable使能与禁用。
4.4 打印
print以及info命令可查看许多变量或信息,此处只简单描述不一一列举,可以在gdb中键入help print或help info来获得指令帮助
4.4.1 print
print 用法较为灵活,输入时简记为‘p’,当程序运行至断点处时可以使用print查看变量信息。
(gdb) b fun
Breakpoint 1 at 0x401558: file main.c, line 13.
(gdb) r
Starting program: main

Breakpoint 1, fun (m=0x7fffffffce17) at main.c:12
12	{
p var #打印变量的值,如果是结构体,会打印完整结构体信息
(gdb) s
13          m->result = m->a + m->b;
(gdb) p m  	# 此处传入为指针 只打印该指针的值
$5 = (m_t *) 0x7fffffffce1c
(gdb) p *m 		# *m 为结构体,会打印所有成员
$6 = {a = 1, b = 2, result = 32767}
(gdb) p m->a	# 也可以打印成员变量
$7 = 1
(gdb)
p /x var #将var以十六进制显示,/x可替换为/o 八进制, /d 十进制
print 指令显示较为复杂的数据结构时,会显得比较繁杂。可以使用 set print pretty on指令来格式化输出
每一次显示不同的变量,内部会将变量进行标识,如$n = ... 为方便打印可以直接输入标识,如p $n
4.4.2 info
info 简写 i ,可以显示正在调试的程序的信息,如:
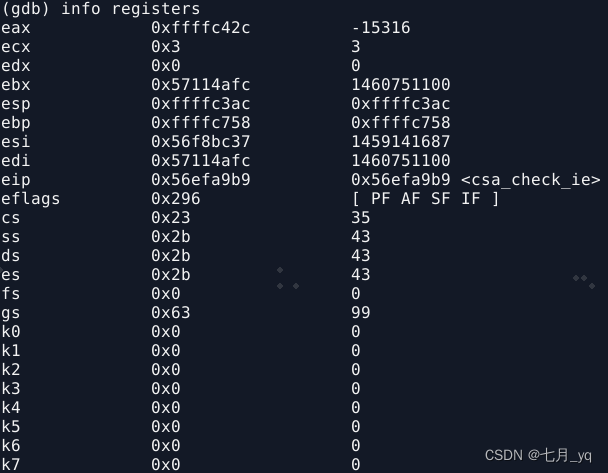
info registers (i r)查看当前通用寄存器信息
4.5 查看调用栈(Backtrace)
当程序运行出现异常停止时,可以键入 bt 指令来查看调用栈
4.6 单步运行
当程序春雨暂停或某断点状态时可以使用如下指令进行单步跟踪调试。
step (简写s) : 程序一行一行运行,如遇到函数体,则进入函数
next (简写n) :程序一行一行运行,如遇到函数不进入函数,直接运行完该函数
continue (简写c):程序继续运行继续执行,到下一个断点处(或运行结束)
until( 简写u) :程序处于循环体内单步跟踪时,until可以运行至退出循环体,若不在,则只执行当前语句
until line : 直接使得程序运行至某行,不仅仅用来跳出循环
finish :运行程序,直到当前函数完成返回,并打印函数返回时的堆栈地址和返回值及参数值等信息。
5 帮助(help)
help cmd_name 获得任意指令的帮助信息,cmd_name是指令名字。
总结
不懂就查,百度什么都有!!!


 6340
6340


 被折叠的 条评论
为什么被折叠?
被折叠的 条评论
为什么被折叠?
 到【灌水乐园】发言


