


文章目录
前提条件
在部署 Dashboard 之前,需要确认以下信息:
1.NebulaGraph 服务已经部署并启动。部署NebulaGraph可以阅读我的这篇文章https://blog.csdn.net/weixin_44328192/article/details/127316061
2.确保9200、9100、9090、8090、7003未被占用
netstat -anltp | grep XX # XX为端口号
3.使用的 Linux 发行版为 CentOS。
我的NebulaGraph的版本为3.2.1
4.安装有版本为 v10.12.0 以上的 Node.js安装Node.js可以阅读我的这篇文章https://blog.csdn.net/weixin_44328192/article/details/127359203
5.安装有版本为 1.13 及以上的 Go安装Go可以阅读我的这篇文章
https://blog.csdn.net/weixin_44328192/article/details/127359882
一、部署Dashboard
1.1、下载 Dashboard
下载:
wget https://oss-cdn.nebula-graph.com.cn/nebula-graph-dashboard/3.1.0/nebula-dashboard-3.1.0.x86_64.tar.gz
解压:
tar -xvf nebula-dashboard-3.1.0.x86_64.tar.gz
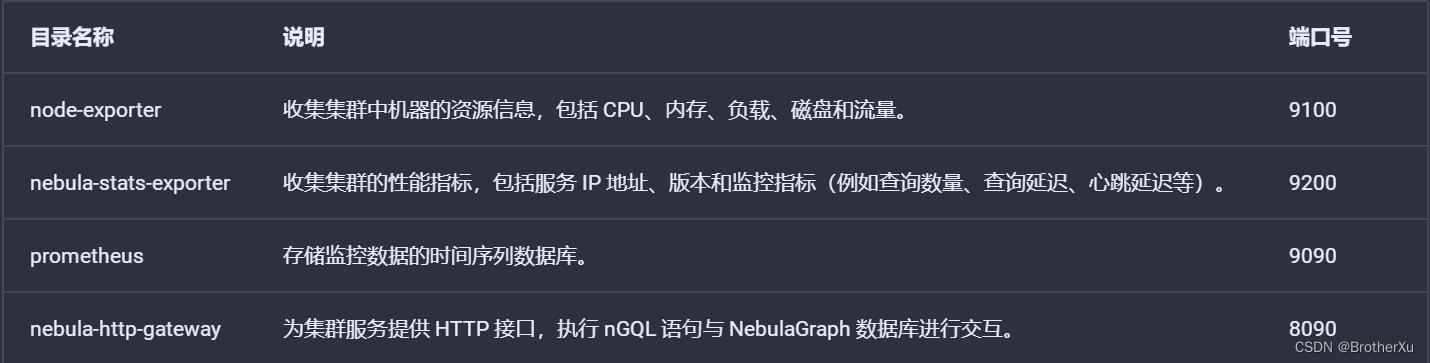
目录nebula-dashboard/vendors内一共有 4 个子目录,说明如下。
1.2、部署node-exporter服务
集群中的每个机器都需要部署node-exporter服务。
在目录node-exporter内执行如下命令启动服务:
在vendors文件夹中新建logs文件夹
nohup ./node-exporter --web.listen-address=":9100" > /opt/module/nebula-dashboard/vendors/logs/node-exporter.log 2>&1 &
服务启动后,可以在浏览器中输入IP:9100检查服务是否正常启动。
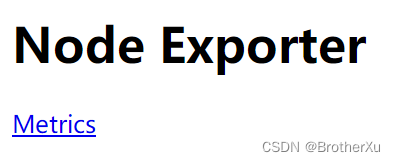
页面显示这个说明正常启动
1.3、部署nebula-stats-exporter服务
只需要在nebula-dashboard服务所在机器部署nebula-stats-exporter服务。
在目录nebula-stats-exporter内修改文件config.yaml,配置所有服务的 HTTP 端口:
clusters:
- name: nebula
  instances:
  - name: metad1
    endpointIP: 192.168.10.101
    endpointPort: 19559
    componentType: metad
  - name: metad2
    endpointIP: 192.168.10.102
    endpointPort: 19559
    componentType: metad
  - name: metad3
    endpointIP: 192.168.10.103
    endpointPort: 19559
    componentType: metad
  - name: graphd1
    endpointIP: 192.168.10.101
    endpointPort: 19669
    componentType: graphd
  - name: graphd2
    endpointIP: 192.168.10.102
    endpointPort: 19669
    componentType: graphd
  - name: graphd3
    endpointIP: 192.168.10.103
    endpointPort: 19669
    componentType: graphd
  - name: storaged1
    endpointIP: 192.168.10.101
    endpointPort: 19779
    componentType: storaged
  - name: storaged2
    endpointIP: 192.168.10.102
    endpointPort: 19779
    componentType: storaged
  - name: storaged3
    endpointIP: 192.168.10.103
    endpointPort: 19779
    componentType: storaged
在目录nebula-stats-exporter内执行如下命令启动服务:
nohup ./nebula-stats-exporter --listen-address=":9200" --bare-metal --bare-metal-config=./config.yaml > /opt/module/nebula-dashboard/vendors/logs/nebula-stats-exporter.log 2>&1 &
服务启动后,可以在浏览器中输入IP:9200检查服务是否正常启动。

页面显示这个说明正常启动
1.4、部署prometheus服务
只需要在nebula-dashboard服务所在机器部署prometheus服务。
在目录prometheus内修改文件prometheus.yaml,配置node-exporter服务和nebula-stats-exporter服务的 IP 地址和端口:
global:
  scrape_interval:     5s
  evaluation_interval: 5s
scrape_configs:
  - job_name: 'node-exporter'
    static_configs:
      - targets: [
          '192.168.10.101:9100',
          '192.168.10.102:9100',
          '192.168.10.103:9100'
        ]
  - job_name: 'nebula-stats-exporter'
    static_configs:
      - targets: [
         '192.168.10.101:9200',
        ]
scrape_interval:收集监控数据的间隔时间。
evaluation_interval:告警规则扫描时间间隔。
执行如下命令启动服务:
nohup ./prometheus --config.file=./prometheus.yaml > /opt/module/nebula-dashboard/vendors/logs/prometheus.log 2>&1 &
服务启动后,可以在浏览器中输入IP:9090检查服务是否正常启动。
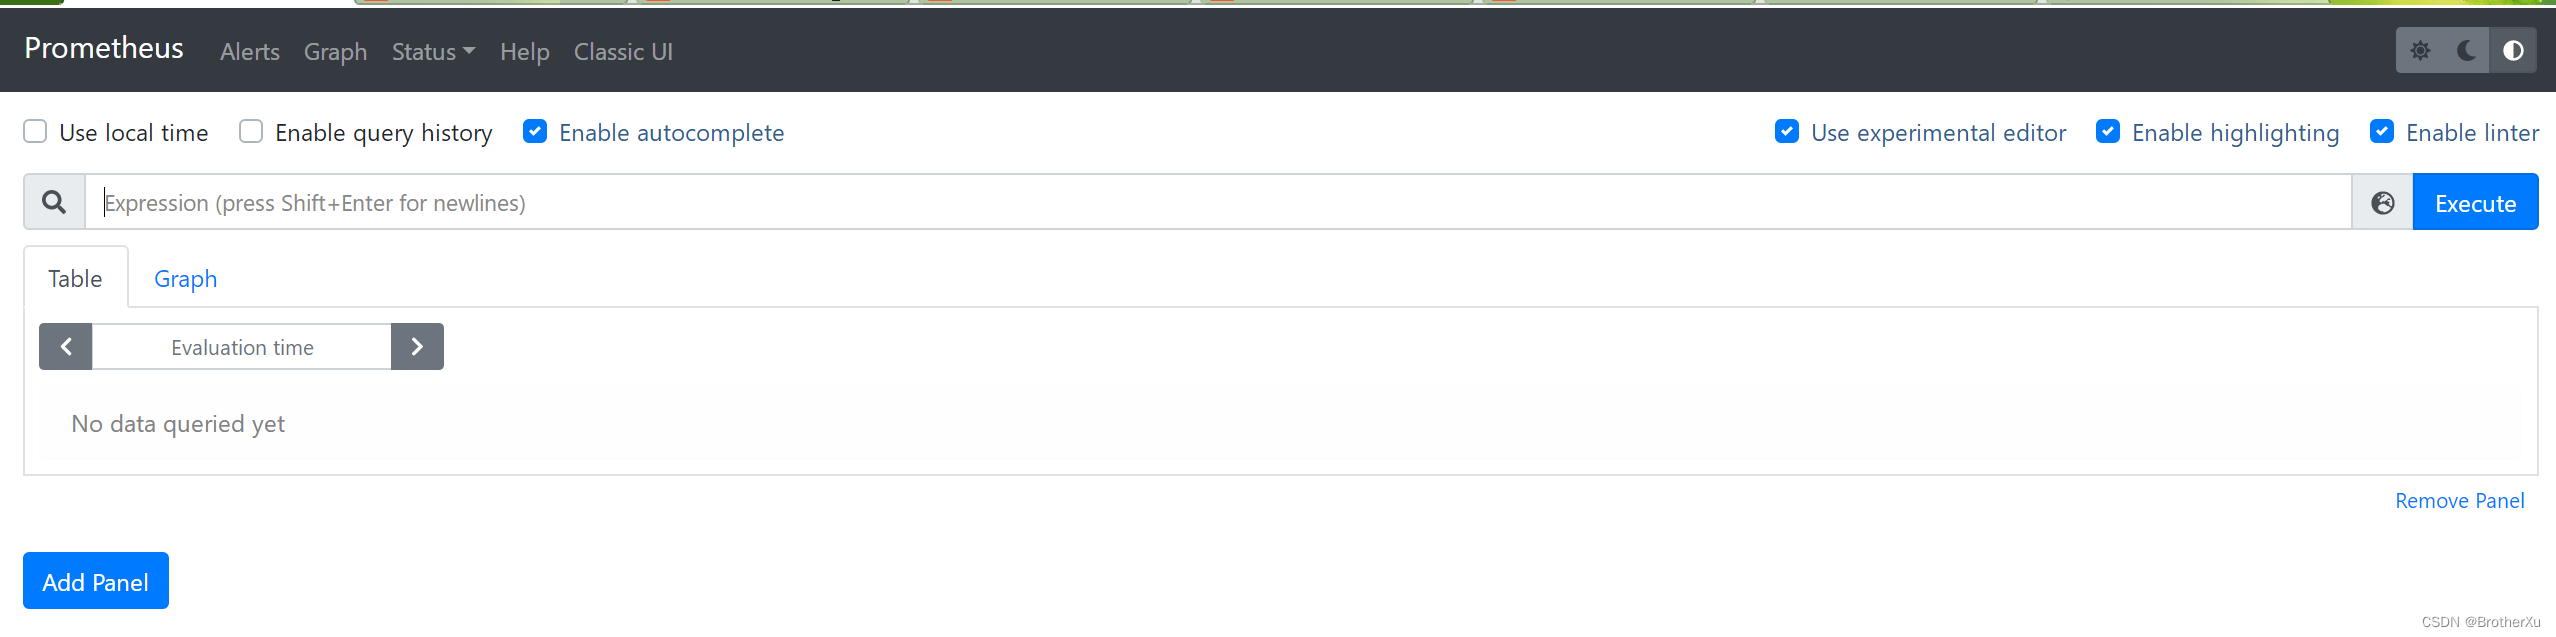
页面显示这个说明正常启动
1.5、部署nebula-http-gateway服务
只需要在nebula-dashboard服务所在机器部署nebula-http-gateway服务。
在目录nebula-http-gateway内执行如下命令启动服务:
nohup ./nebula-httpd > /opt/module/nebula-dashboard/vendors/logs/nebula-httpd.log 2>&1 &
服务启动后,可以在浏览器中输入IP:8090检查服务是否正常启动。
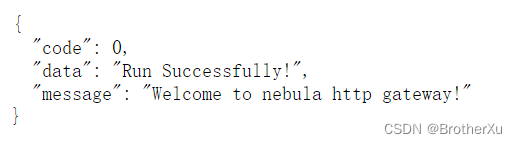
页面显示这个说明正常启动
1.6、部署dashboard服务
在目录nebula-dashboard内修改文件config.json,配置代理信息:
{
  "port": 7003,
  "proxy":{
    "gateway":{
      "target": "192.168.10.101:8090" //  nebula-http-gateway 服务的 IP 和端口号。
    },
    "prometheus":{
      "target": "192.168.10.101:9090" // Prometheus 服务的 IP 和端口号。
    },
    "graph":{
      "target": "192.168.10.101:19669" // 用于获取 Graph 服务的运行配置。
    },
    "storage":{
      "target": "192.168.10.101:19779" // 用于获取 Storage 服务的运行配置。
    }
  },
  "nebulaServer": {
    "ip": "192.168.10.101",  // 任一 Graph 服务的机器 IP。
    "port": 9669 // Graph 服务的端口号。
  }
}
在目录nebula-dashboard内执行如下命令启动服务:
nohup ./dashboard > /opt/module/nebula-dashboard/vendors/logs/nebula-dashboard.log 2>&1 &
服务启动后,可以在浏览器中输入:7003检查服务是否正常启动。

页面显示这个说明正常启动
二、连接 Dashboard
1.确认nebula-dashboard服务所在机器的 IP 地址,在浏览器中输入IP:7003打开登录页面。
2.输入 NebulaGraph 数据库的账号和密码
注:
①如果 NebulaGraph 已经启用身份验证,用户可以使用已创建的账号连接 Dashboard。
②如果 NebulaGraph 未启用身份验证,用户只能使用默认用户root和任意密码连接 Dashboard。
3.选择 NebulaGraph 的版本。


 7491
7491


 被折叠的 条评论
为什么被折叠?
被折叠的 条评论
为什么被折叠?
 到【灌水乐园】发言


