


 本文介绍了如何在Vue.js项目中安装并使用ECharts-liquidfill插件,展示了如何初始化液态填充水球图,设置图形样式和数据。
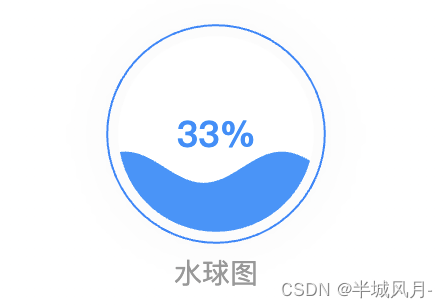
1、效果图
2、代码部分
(1)先安装,npm install
npm install echarts-liquidfill(2) 页面中引入
import 'echarts-liquidfill';(3)代码
var myChart1 = this.$echarts.init(document.getElementById('tenant-chart-4'));
var title = '水球图';
let option = {
  graphic: {
    type: 'text',
    left: 'center',
    top: '84%',
    style: {
      text: title,
      textAlign: 'center',//居中对齐
      fill: '#999',//填充色
      fontSize: 14,
      fontWeight: 400,
      fontFamily: "Source Han Sans CN",
    },
  },
  series: [
    {
      name: '水球图',
      type: 'liquidFill',
      radius: '68%',
      z: 1,
      center: ['50%', '45%'],
      backgroundStyle: {
        color : '#ffffff'
      },
      label: {
        color: '#1890FF',
        fontSize: 18,
      },
      itemStyle: {
        color: '#1890FF',
        shadowColor: 'rgba(0, 0, 0, 0)',
      },
      outline: {
        show: true,
        borderDistance: 5,
        itemStyle: {
          borderColor: 'rgba(17, 137, 255, 1)',
          backgroundColor: '#1890FF',
          borderStyle: 'dashed',
          borderWidth: 1
        }
      },
      data: ['0.33',]
    },
  ]
};
myChart1.setOption(option);
setTimeout(function () {
  window.addEventListener("resize",()=>{
    myChart1.resize()
  })
}, 200)


 856
856

 被折叠的 条评论
为什么被折叠?
被折叠的 条评论
为什么被折叠?
 到【灌水乐园】发言


