


知识点:单变量线性回归
问题:根据ex1data1.txt中的数据预测小吃店的利润。
import numpy as np
import pandas as pd
import matplotlib.pyplot as plt
注:numpy支持维度数组与矩阵运算,pandas用于数据分析,matplotlib可视化
# 读取数据
path = 'D:\python\机器学习\code\ex1\data\ex1data1.txt'
# header=None 指定原始文件数据没有列索引
data = pd.read_csv(path, header=None, names=['Population', 'Profit'])
data.plot(kind='scatter', x='Population', y='Profit', figsize=(12,8))
plt.show()

#  对数据集进行处理
# 在第0列插入1,列名为Ones 方便使用向量化计算代价和梯度
data.insert(0,'Ones',1)
cols = data.shape[1] # 计算列数
X = data.iloc[:,:-1] # 训练集 data里除了最后一列
y = data.iloc[:,cols-1:cols] # 目标集 最后一列
# [起始行:终止行,起始列:终止列] 前闭后开
检查是否正确
X.head()

y.head()

由于代价函数是矩阵,所以需要转换X,y。 同同时需要初始化theta。
X = np.matrix(X.values)
y = np.matrix(y.values)
theta = np.matrix(np.array([0,0]))
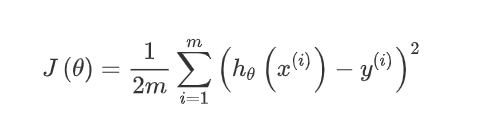
# 计算代价函数
def computeCost(X, y, theta):
    inner = np.power((X*theta.T)-y,2)
    return np.sum(inner)/(2*len(X))
此处计算的是J(θ),变量为θ
# 梯度下降 实现θ的更新
def gradientDescent(X,y,theta,alpha,iters):
    temp = np.matrix(np.zeros(theta.shape))
    parameters = int(theta.ravel().shape[1])# ravel扁平化操作变成一维,计算参数的个数
    cost = np.zeros(iters)
    for i in range(iters):
        error = (X*theta.T)-y
        for j in range(parameters):
            term = np.multiply(error,X[:,j])
            temp[0,j] = theta[0,j]-((alpha/len(X))*np.sum(term))
        theta = temp
        cost[i] = computeCost(X,y,theta)
    return theta,cost
# 学习率 迭代次数
alpha = 0.01
iters = 1500
g,cost = gradientDescent(X,y,theta,alpha,iters)
g
out:matrix([[-3.63029144, 1.16636235]])
# 可视化
x = np.linspace(data.Population.min(), data.Population.max(), 100)
f = g[0, 0] + (g[0, 1] * x)
fig, ax = plt.subplots(figsize=(12,8))#拟合曲线
ax.plot(x, f, 'r', label='Prediction')
ax.scatter(data.Population, data.Profit, label='Traning Data')
ax.legend(loc=2)
ax.set_xlabel('Population')
ax.set_ylabel('Profit')
ax.set_title('Predicted Profit vs. Population Size')
plt.show()
plt.plot(range(0,1500),cost)
plt.show()


 1126
1126


 被折叠的 条评论
为什么被折叠?
被折叠的 条评论
为什么被折叠?
 到【灌水乐园】发言


