


详细配置项可跳转至我的文章 ReactEcharts常见基础配置项解析
代码实现
import React from 'react';
import ReactEcharts from 'echarts-for-react';
import * as echarts from 'echarts';

export default function LineEcharts(props) {
    const { dataList, nameList } = props;
    let option = {
        background:
            'linear-gradient(270deg, rgba(0,0,0,0) 0%, rgba(3,7,22,0.73) 47%, #061135 100%);',
        grid: {
            left: '10%',
            right: '10%',
            top: '30%',
            bottom: '10%',
            containLabel: true,
        },
        tooltip: {
            show: true,
            trigger: 'item',
            confine: true,
        },
        legend: {
            show: true,
            data: ['案例1', '案例2'],
            top: '10%',
            left: 'center',
            icon: 'rect',
            textStyle: {
                color: '#fff',
            },
        },
        xAxis: [
            {
                type: 'category',
                name: 'X轴',
                nameLocation: 'end',
                nameTextStyle: {
                    nameGap: 10, //坐标轴名称与轴线之间的距离
                    nameRotate: 0, // 坐标轴名字旋转
                },
                boundaryGap: false,
                // 轴线配置
                axisLine: {
                    show: true,
                    lineStyle: {
                        color: 'rgba(255,255,255,0.2)',
                        type: 'solid',
                        width: 1,
                    },
                },
                // 刻线
                axisTick: {
                    show: true,
                    length: 10,
                },
                // x轴标签配置
                axisLabel: {
                    show: true,
                    rotate: 30, //旋转角度
                    margin: 30, // 刻度标签和轴线之间的距离
                    formatter: (value, index) => {
                        return `${value}++`;
                    },
                },
                splitLine: {
                    // 分割线
                    show: true,
                    lineStyle: {
                        color: 'rgba(255,255,255,0.2)',
                    },
                },
                data: nameList,
            },
        ],
        yAxis: [
            {
                type: 'value',
                name: '单位:分',
                nameTextStyle: {
                    align: 'right',
                    verticalAlign: 'bottom',
                    padding: [5, 0, 0, 0], //调整Y轴单位位置
                    color: '#fff',
                    fontWeight: 500, // 调整Y轴单位字号
                },
                axisLabel: {
                    formatter: '{value}分',
                    textStyle: {
                        color: '#ccc222',
                    },
                },
                axisLine: {
                    lineStyle: {
                        color: '#a11',
                    },
                },
                axisTick: {
                    show: false,
                },
                splitLine: {
                    show: true,
                    lineStyle: {
                        type: 'dashed',
                        color: 'rgba(0,192,255,0.6)',
                    },
                },
            },
        ],
        series: [
            {
                name: '案例1',
                type: 'line',
                stack: '总量',
                symbol: 'circle',
                symbolSize: 8,
                itemStyle: {
                    color: '#16B2FB',
                },
                lineStyle: {
                    color: '#16B2FB',
                    width: 1,
                    borderWidth: 2,
                },
                opacity: 0,
                areaStyle: {
                    color: new echarts.graphic.LinearGradient(0, 0, 0, 1, [
                        {
                            offset: 0,
                            color: 'rgba(22,178,251,0.8)',
                        },
                        {
                            offset: 1,
                            color: 'rgba(139, 185, 255, 0.01)',
                        },
                    ]),
                },
                data: dataList,
            },
        ],
    };
    return (
        <ReactEcharts
            option={option}
            notMerge
            lazyUpdate
            style={{ height: '400px', width: '400px' }}
        />
    );
}
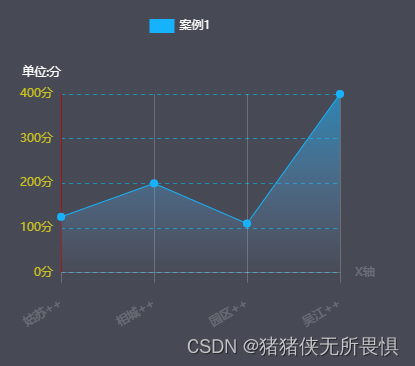
效果图


 6165
6165


 被折叠的 条评论
为什么被折叠?
被折叠的 条评论
为什么被折叠?
 到【灌水乐园】发言


