


1.中文label报错如何解决
1.1 问题描述
通常,能够直接使用中文,但偶尔也会出现中文乱的情况,且出现无法找到字体的提示。
ax.set_xlabel("时间(s)", fontsize=xLabelSize) # 设置x轴名称
ax.set_ylabel("模拟时间(s)", fontsize=yLabelSize) # 设置y轴名称
报错:

图片中文乱码:
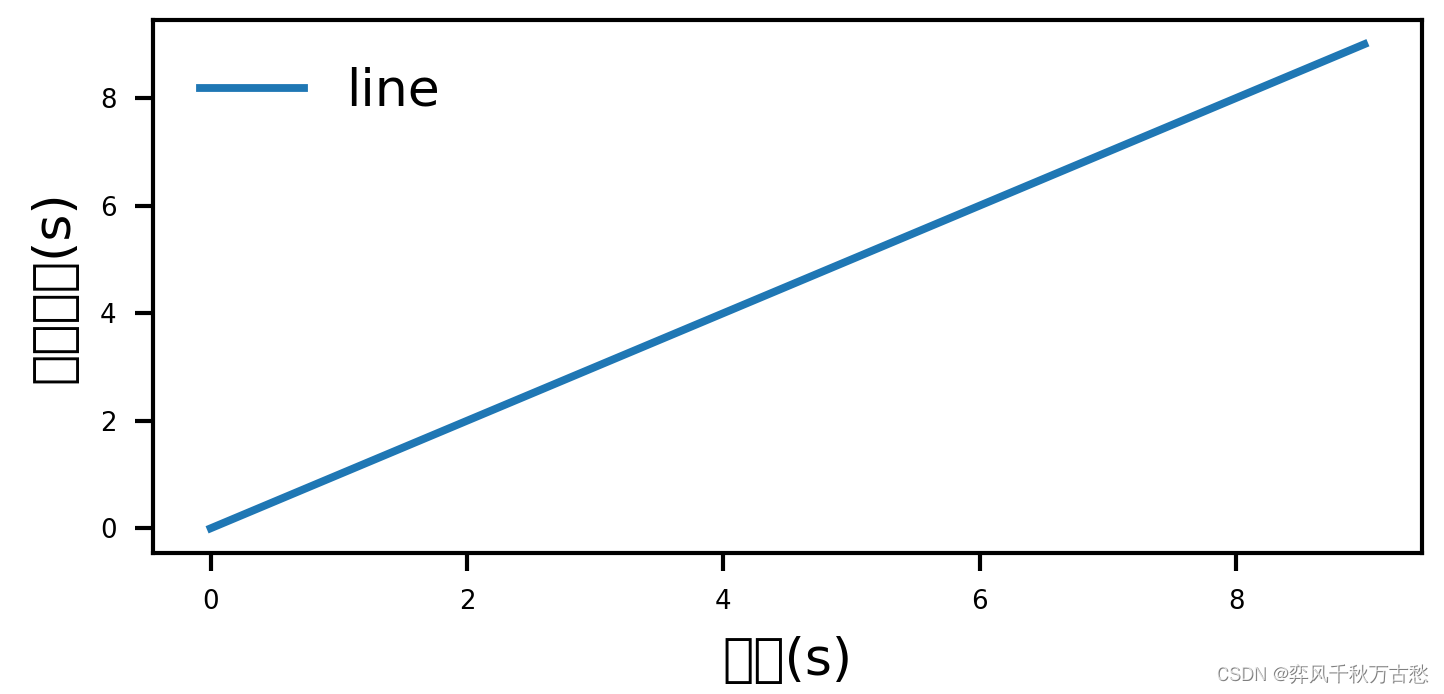
1.2 解决方法
from matplotlib.font_manager import FontProperties
fontSize = 10.5 # 字体大小
legendFont = fontSize
cnFont=FontProperties(fname='C:\Windows\Fonts\simsun.ttc',size=fontSize) # 指定字体
legendFont = FontProperties(fname='C:\Windows\Fonts\simsun.ttc',size=legendSize) # 指定legend字体
# 这里fname是对应字体文件的路径,根据自己的需求选择或下载字体
# size指定字体的大小
(1)坐标轴名称:
ax.set_xlabel("时间(s)", fontproperties=cnFont) # 设置x轴名称
# 通过fontproperties属性指定字体
(2)legend图例:
ax.legend(prop=legendFont)
# 通过prop属性指定legend
(3)任意添加text
参考官网说明
ax.text(5,4,'标注',fontproperties=cnFont)
# x,y,标注字符串
# fontproperties指定字体
# c指定颜色,
(4)例子
import matplotlib.pyplot as plt
import numpy as np
from matplotlib.font_manager import FontProperties
fig,ax = plt.subplots(figsize=(4,2),dpi=300)
x = range(0,10,1)
y = x
xLabelSize = 10
yLabelSize = xLabelSize
legendSize = 10
cnFont=FontProperties(fname='C:\Windows\Fonts\simsun.ttc',size=xLabelSize) # 指定字体
legendFont = FontProperties(fname='C:\Windows\Fonts\simsun.ttc',size=legendSize) # 指定字体
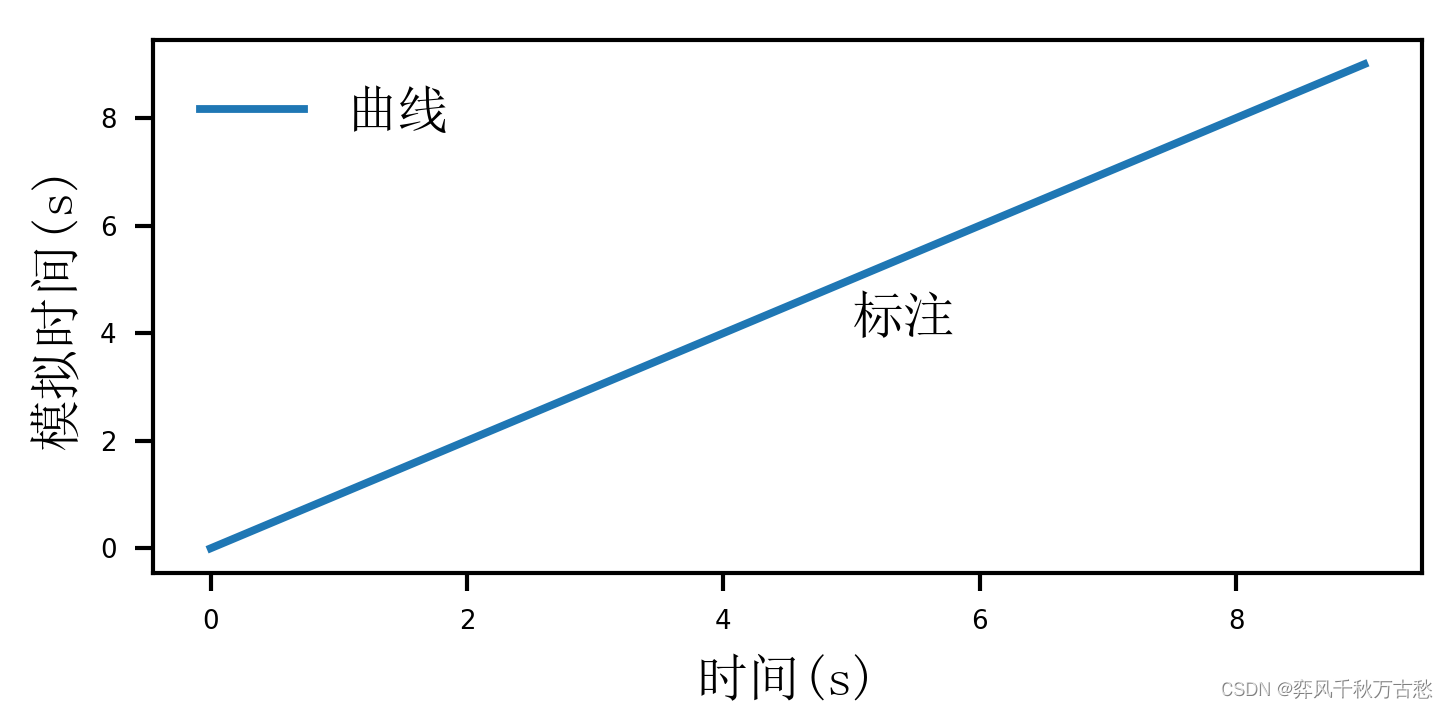
ax.plot(x,y,label='曲线')
ax.legend(frameon=False,loc='best',ncols=1,prop=legendFont) # 1列
ax.set_xlabel("时间(s)", fontproperties=cnFont) # 设置x轴名称
ax.set_ylabel("模拟时间(s)", fontproperties=cnFont) # 设置y轴名称
ax.text(5,4,'标注',fontproperties=cnFont)
xTickLabelSize = 5
yTickLabelSize = xTickLabelSize
ax.tick_params(axis='x', labelsize=xTickLabelSize) # 设置x轴刻度的字体大小
ax.tick_params(axis='y', labelsize=yTickLabelSize) # 设置y轴刻度的字体大小
plt.subplots_adjust(left=0.12,top=0.9,bottom=0.19,right=0.966) # 调整图幅边距
plt.show()
2. 坐标轴刻度科学计数法表示
参考官网
(1)指定科学计数法
# 指定ticklabel的格式
ax.ticklabel_format(axis='y',style='sci', scilimits=(-2,2),useMathText=True)
# axis 指定坐标轴,这里是y轴
# style 指定格式,这里是科学计数法,还有'plain'普通模式
# silimits :(-a,b)在10^-a~10^b外的数据采用科学计数法表示
# useMathText: 科学计数法用x10表示。认为为False,用e表示
(2)指定科学计数法字体大小
# 指定科学计数法label的字体大小
yTickLabelSize = 8
ax.yaxis.get_offset_text().set_fontsize(yTickLabelSize) # 这里指定科学技术法符号的大小
(3)举例子
import matplotlib.pyplot as plt
import numpy as np
fig,ax = plt.subplots(figsize=(4,2),dpi=300)
x = range(0,10000,1)
y = x
xLabelSize = 10
yLabelSize = xLabelSize
legendSize = 10
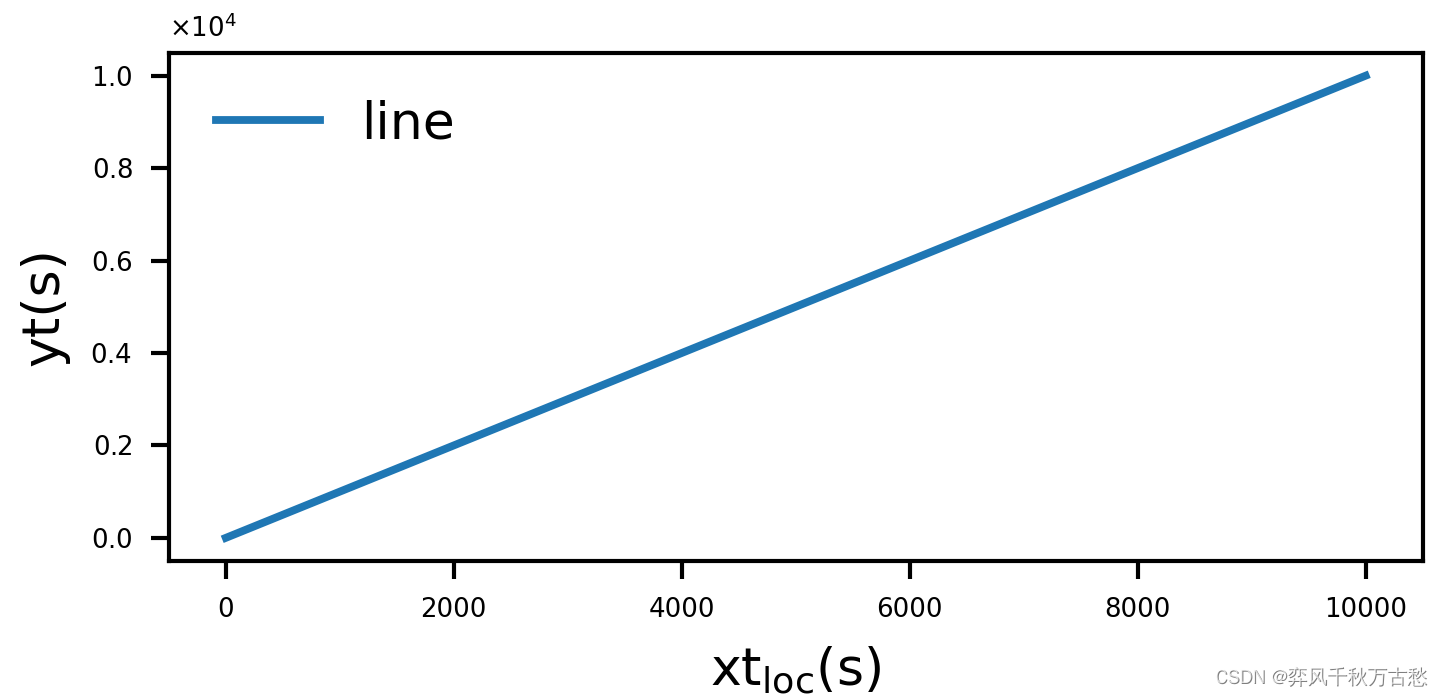
ax.plot(x,y,label='line')
ax.legend(frameon=False,loc='best',fontsize=legendSize,ncols=1) # 1列
ax.set_xlabel("xt$\mathregular{_{loc}}$(s)", fontsize=xLabelSize) # 设置x轴名称
ax.set_ylabel("yt(s)", fontsize=yLabelSize) # 设置y轴名称
xTickLabelSize = 5
yTickLabelSize = xTickLabelSize
ax.tick_params(axis='x', labelsize=xTickLabelSize) # 设置x轴刻度的字体大小
ax.tick_params(axis='y', labelsize=yTickLabelSize) # 设置y轴刻度的字体大小
# *********************************
ax.ticklabel_format(axis='y',style='sci', scilimits=(-2,2),useMathText=True) # 指定ticklabel的格式
ax.yaxis.get_offset_text().set_fontsize(yTickLabelSize)# 指定科学计数法label的字体大小
# ********************************
plt.subplots_adjust(left=0.12,top=0.9,bottom=0.19,right=0.966) # 调整图幅边距
plt.show()
3. 指定坐标轴tick和对应的值
(1)目前还未尝试中文,英文字符串可以正常显示
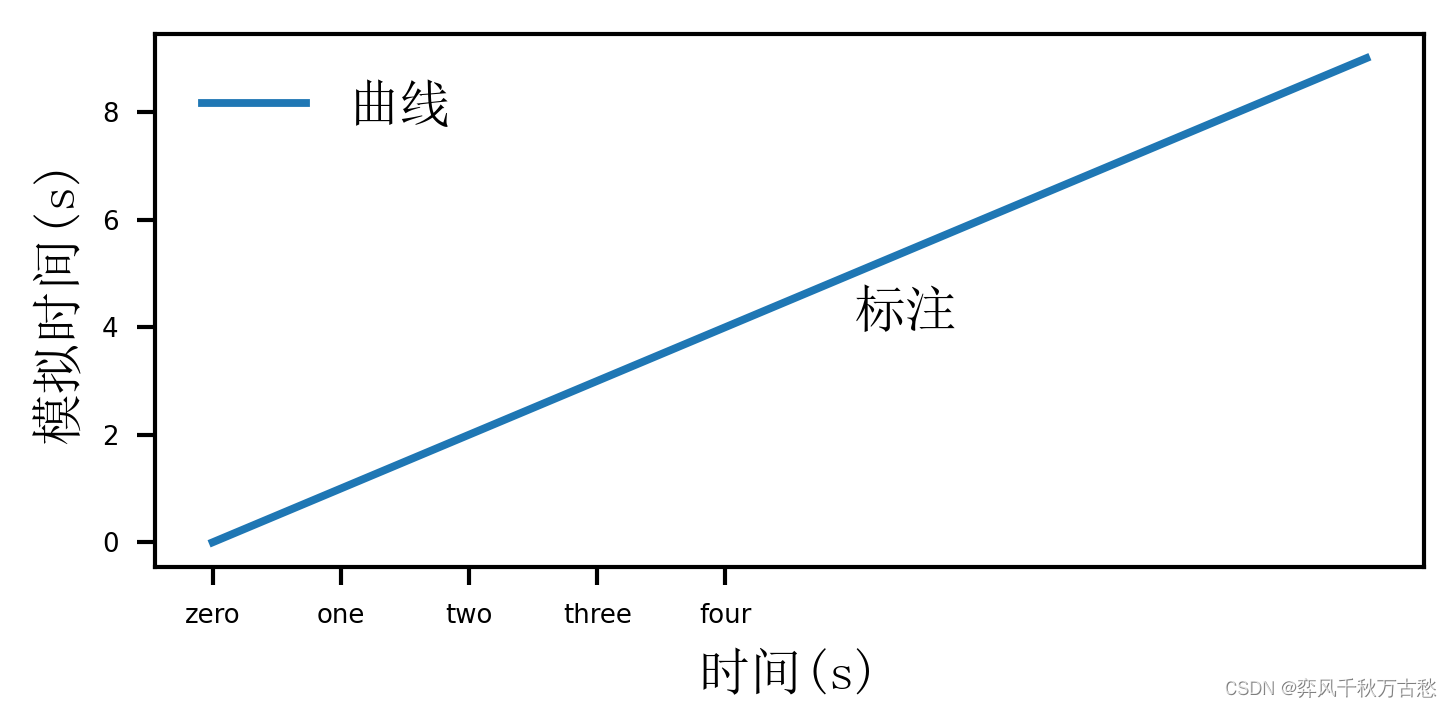
ax.set_xticks([0,1,2,3,4]) # 指定x轴要显示的实际刻度
ax.set_xticklabels(['zero','one','two','three','four']) # 与上一行一一对应,替换为字符串
(2)举例
import matplotlib.pyplot as plt
import numpy as np
from matplotlib.font_manager import FontProperties


fig,ax = plt.subplots(figsize=(4,2),dpi=300)
x = range(0,10,1)
y = x
xLabelSize = 10
yLabelSize = xLabelSize
legendSize = 10
cnFont=FontProperties(fname='C:\Windows\Fonts\simsun.ttc',size=xLabelSize) # 指定字体
legendFont = FontProperties(fname='C:\Windows\Fonts\simsun.ttc',size=legendSize) # 指定字体
ax.plot(x,y,label='曲线')
ax.legend(frameon=False,loc='best',ncols=1,prop=legendFont) # 1列

ax.set_xlabel("时间(s)", fontproperties=cnFont) # 设置x轴名称
ax.set_ylabel("模拟时间(s)", fontproperties=cnFont) # 设置y轴名称
ax.text(5,4,'标注',fontproperties=cnFont)

xTickLabelSize = 5
yTickLabelSize = xTickLabelSize
ax.tick_params(axis='x', labelsize=xTickLabelSize)  # 设置x轴刻度的字体大小
ax.tick_params(axis='y', labelsize=yTickLabelSize)  # 设置y轴刻度的字体大小

ax.set_xticks([0,1,2,3,4])
ax.set_xticklabels(['zero','one','two','three','four'])


plt.subplots_adjust(left=0.12,top=0.9,bottom=0.19,right=0.966) # 调整图幅边距
plt.show()


 2218
2218


 被折叠的 条评论
为什么被折叠?
被折叠的 条评论
为什么被折叠?
 到【灌水乐园】发言


