


Canvas 实战: 水波图
简介
由于 Canvas 的基础功能太广了,有机会的话会出一篇基础的 Canvas 使用教学。本篇就暂时先默认小伙伴已经看过一些些 Canvas 基础(其实只要知道 getContext('2d') 就行啦),本篇将来介绍使用 Canvas 画出一个动态的水波图,详细公式和过程可以查阅参考一的链接哦~
参考
| Canvas制作水波图实现原理 | https://mp.weixin.qq.com/s/-nLlq5qI6OzXgJEkaxEgjA |
正文
实现原理
由于参考一的推送已经介绍的很详细了,所以这边就简单带过~
什么是波浪,其实波浪的形状就是一种正弦波(sin)和余弦波(cos)合并的复合波形,本篇就简单使用最基本的正弦(sin)三角函数来实现啦
公式: a sin ( b x + c ) + d a \sin(bx + c) + d asin(bx+c)+d
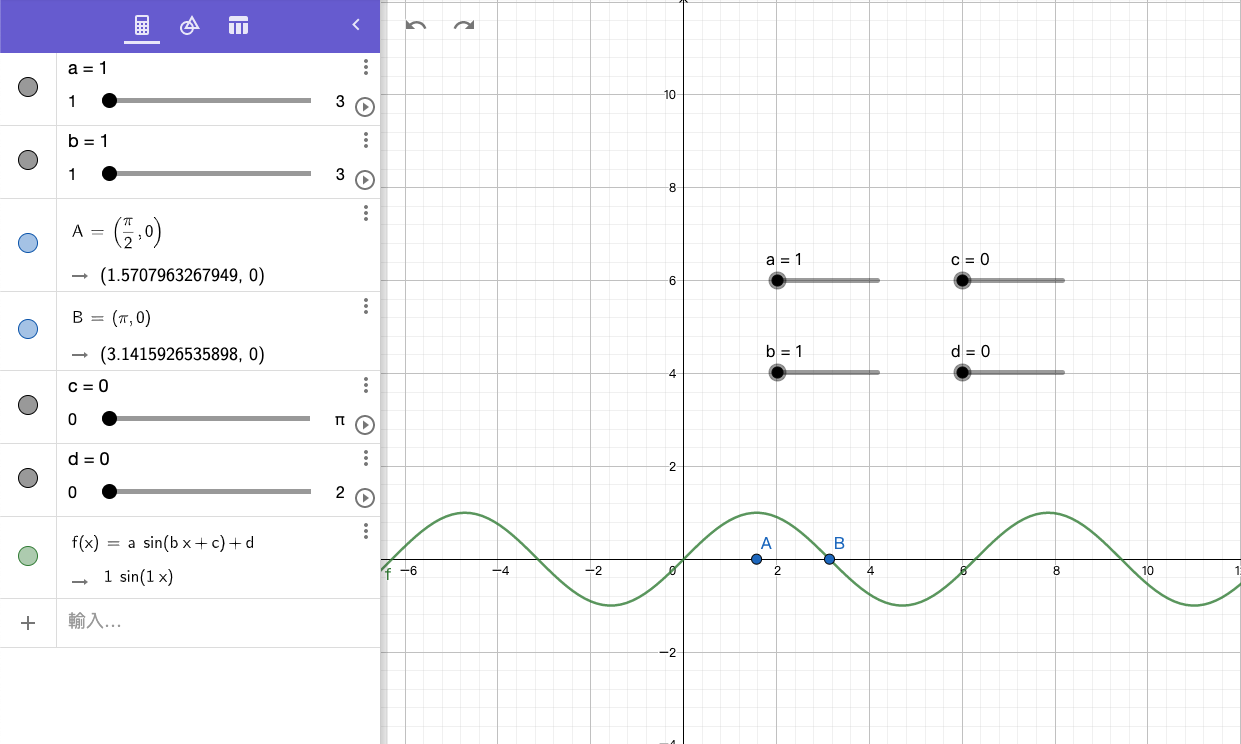
(图形使用 ggb 线上工具实现)
与图形相关的导出量如下:
- 周期 T = 2 π / b T = 2\pi / b T=2π/b
- 振幅 R = a R = a R=a
- 水平位移 W = c W = c W=c (向左)
- 垂直位移 H = d H = d H=d (向下)
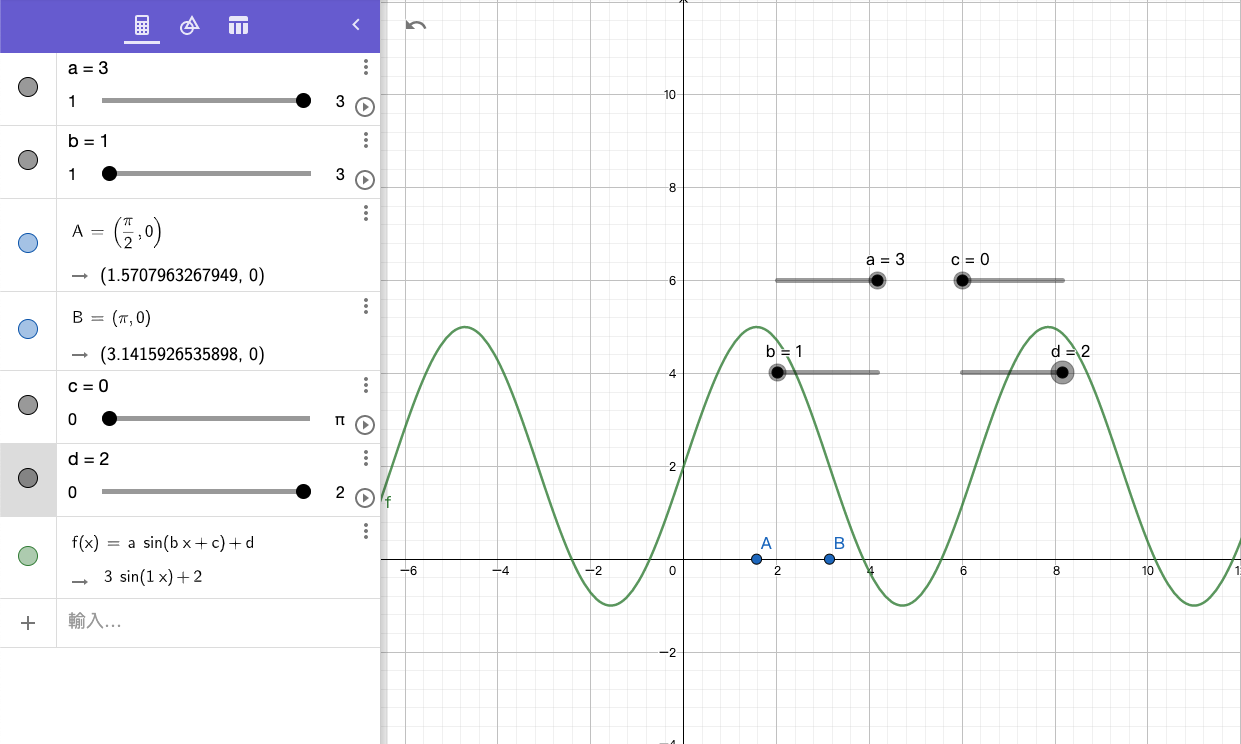
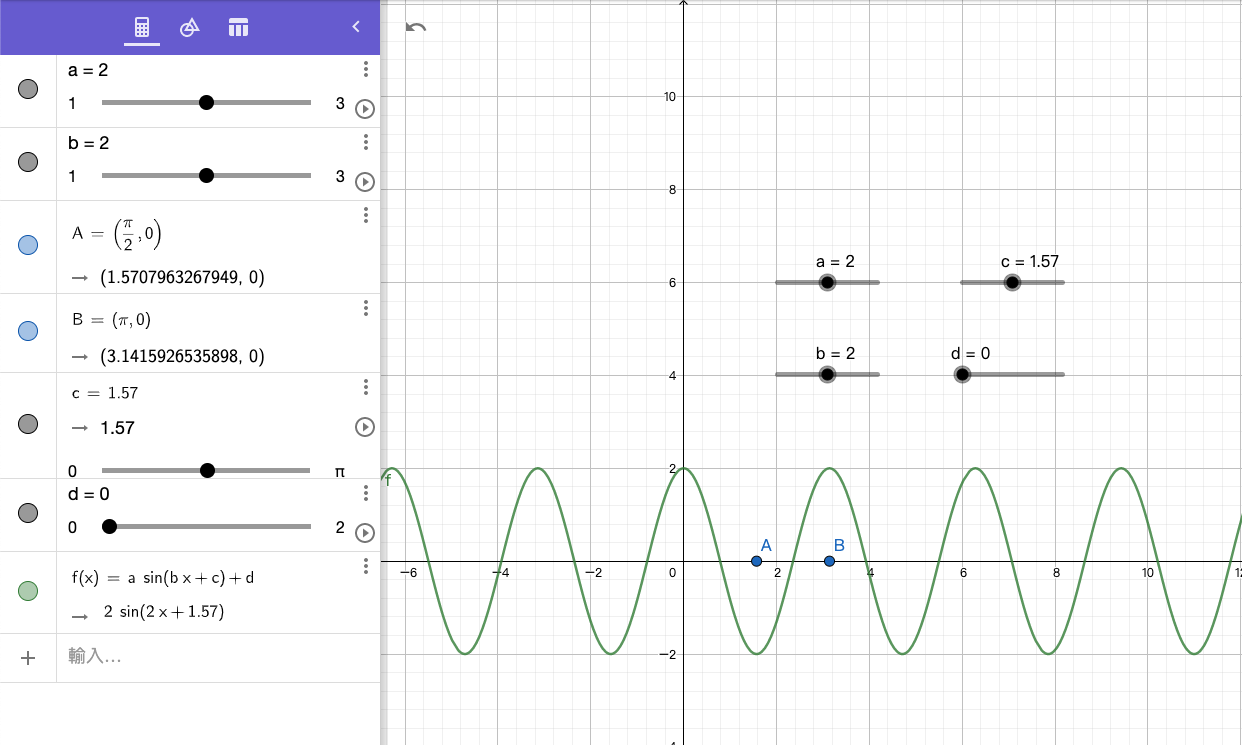
这边给出几张以上图为基础改变参数后的图形:
- 增加振幅(a)并向上偏移(d)
- 缩短周期(b)并向左位移©
接下来我们要实现的目标就是使用 canvas 绘制出 sin 图形后,无限向左移动就成啦!
绘图开始
接下来就开始绘图啦,先给出我们的文件结构
/canvas-wave
|- index.html
|- index.css
|- index.js
基础文件内容如下(html、css部分代码不会改变)
index.html
<!DOCTYPE html>
<html lang="en">
<head>
    <meta charset="UTF-8">
    <meta name="viewport" content="width=device-width, initial-scale=1.0">
    <link rel="stylesheet" href="index.css">
    <title>Canvas Wave</title>
</head>
<body>
    <h1>使用 Canvas 实现水波图</h1>

    <div class="wrapper">
        <canvas id="canvas"></canvas>
    </div>

    <script src="index.js"></script>
</body>
</html>
index.css
body {
    margin: 0;
    text-align: center;
}

.wrapper {
    width: 75vw;
    height: 80vh;
    margin: 0 auto;
}
接下来开始填充 js 文件的内容
绘制基本 sin 图形
首先我们利用网页加载完毕时的回调函数 window.onload 来启动我们的绘图方法并加入绘制 sin 图形的函数,先上代码
index.js
window.onload = function () {
  // 获取 canvas 上下文
  const canvas = document.querySelector('#canvas')
  const canvasWidth = canvas.width = 500
  const canvasHeight = canvas.height = 500
  const ctx = canvas.getContext('2d')

  drawSin(ctx)

  function drawSin (ctx) {
    const points = []
    const startX = 0
    const waveWidth = 0.05 // 波浪周期,公式中替代 b
    const waveHeight = 20 // 波浪高度,公式中替代 a

    ctx.beginPath()
    for (let x = startX ; x < startX + canvasWidth ; x += 20 / canvasWidth) {
      // 计算高度
      let y = waveHeight * Math.sin((startX + x) * waveWidth)
      y += canvasHeight / 2 // 置于图中线
      points.push([x, y])
      ctx.lineTo(x, y)
    }
    ctx.lineTo(canvasWidth, canvasHeight)
    ctx.lineTo(startX, canvasHeight)
    ctx.lineTo(...points[0])
    ctx.stroke()
  }
}
在中间我们使用 waveHeight * Math.sin((startX + x) * waveWidth) 作为
a
sin
(
b
x
)
a \sin(bx)
asin(bx),绘制出来的效果如下

使波形流动
绘制出 sin 波形之后,接下来我们要让波形开始向左位移。接下来我们需要多两个动作,利用 requestAnimationFrame 方法在每一帧清除画布并绘制位移后的波形,透过视觉暂留起到动画的效果
index.js
window.onload = function () {
  const canvas = document.querySelector('#canvas')
  const canvasWidth = canvas.width = 500
  const canvasHeight = canvas.height = 500

  // 记录当前偏移量
  let xOffset = 0
  // 偏移量移动速度间距,60 帧/s -> 一秒移动 6
  const speed = 0.1

  requestAnimationFrame(draw)

  // 每帧进行重绘
  function draw () {
    const ctx = canvas.getContext('2d')
    // 清除上一帧的图形
    ctx.clearRect(0, 0, canvasWidth, canvasHeight)
    // 图形重绘
    drawSin(ctx, xOffset)
    // 递归调用 -> 等到下一帧进行重绘
    xOffset += speed
    requestAnimationFrame(draw)
  }

  function drawSin (ctx, xOffset) {
    const points = []
    const startX = 0
    const waveWidth = 0.05
    const waveHeight = 20

    ctx.beginPath()
    for (let x = startX ; x < startX + canvasWidth ; x += 20 / canvasWidth) {
      // a * sin(b * x) -> a * sin(b * x + c)
      let y = waveHeight * Math.sin((startX + x) * waveWidth + xOffset)
      y += canvasHeight / 2
      points.push([x, y])
      ctx.lineTo(x, y)
    }
    ctx.lineTo(canvasWidth, canvasHeight)
    ctx.lineTo(startX, canvasHeight)
    ctx.lineTo(...points[0])
    ctx.stroke()
  }
}
我们增加新的全局变量 xOffset、speed,分别记录当前横向偏移量和偏移量移动固定速率。并将每帧重绘的函数包装成 draw 并递归调用,每次偏移量递增,效果如下:
上色并切边
最后我们为波浪上色(涂色填满使用 fill 函数)并将边缘切成圆形(切边使用 clip 函数)
index.js
window.onload = function () {
  const canvas = document.querySelector('#canvas')
  const canvasWidth = canvas.width = 500
  const canvasHeight = canvas.height = 500

  let xOffset = 0
  const speed = 0.1
  const blue1 = '#3399FF'

  drawCircle() // 初始化切边圆形
  const ctx = canvas.getContext('2d')
  ctx.strokeStyle = blue1 // 以蓝色填满
  ctx.fillStyle = blue1 // 以蓝色填满
  requestAnimationFrame(draw)

  function drawCircle () {
    const ctx = canvas.getContext('2d')
    const r = canvasWidth / 2
    const lineWidth = 10
    const cR = r - lineWidth
    ctx.fillStyle = '#000000' // 黑边
    ctx.lineWidth = lineWidth
    ctx.beginPath()
    // 画圆并切边
    ctx.arc(r, r, cR, 0, 2 * Math.PI)
    ctx.stroke()
    ctx.clip()
  }

  function draw () {
    const ctx = canvas.getContext('2d')
    ctx.clearRect(0, 0, canvasWidth, canvasHeight)
    drawSin(ctx, xOffset)
    xOffset += speed
    requestAnimationFrame(draw)
  }

  function drawSin (ctx, xOffset) {
    const points = []
    const startX = 0
    const waveWidth = 0.05
    const waveHeight = 20

    ctx.beginPath()
    for (let x = startX ; x < startX + canvasWidth ; x += 20 / canvasWidth) {
      let y = waveHeight * Math.sin((startX + x) * waveWidth + xOffset)
      y += canvasHeight / 2
      points.push([x, y])
      ctx.lineTo(x, y)
    }
    ctx.lineTo(canvasWidth, canvasHeight)
    ctx.lineTo(startX, canvasHeight)
    ctx.lineTo(...points[0])
    ctx.stroke()
    // 图形填满颜色
    ctx.fill()
  }
}
其实到此已经几乎完成了,就是这个波浪有些单调,下面我们将展示最终版本
完成
最后我们将波浪的垂直偏移量、浪高、周期都改成透过参数输入,并绘制另一个拥有不同周期的浪置于背景来提高层次感
index.js
window.onload = function () {
  const canvas = document.querySelector('#canvas')
  const canvasWidth = canvas.width = 500
  const canvasHeight = canvas.height = 500

  let xOffset = 0
  const speed = 0.1
  const blue1 = '#3399FF'
  const blue2 = '#3366FF'

  drawCircle()
  requestAnimationFrame(draw)

  function drawCircle () {
    const ctx = canvas.getContext('2d')
    const r = canvasWidth / 2
    const lineWidth = 10
    const cR = r - lineWidth
    ctx.fillStyle = '#000000'
    ctx.lineWidth = lineWidth
    ctx.beginPath()
    ctx.arc(r, r, cR, 0, 2 * Math.PI)
    ctx.stroke()
    ctx.clip()
  }

  function draw () {
    const ctx = canvas.getContext('2d')
    ctx.clearRect(0, 0, canvasWidth, canvasHeight)
    // 背景的波浪
    ctx.strokeStyle = blue1
    ctx.fillStyle = blue1
    drawSin(ctx, xOffset, 3, 0.03, 12)
    // 前景的波浪
    ctx.strokeStyle = blue2
    ctx.fillStyle = blue2
    drawSin(ctx, xOffset, 0, 0.05, 15)
    xOffset += speed
    requestAnimationFrame(draw)
  }

  // 添加后参数:画布上下文、水平偏移量、垂直偏移量、波浪周期、波浪高度
  function drawSin (ctx, xOffset = 0, yOffset = 0, waveWidth = 0.05, waveHeight = 20) {
    const points = []
    const startX = 0

    ctx.beginPath()
    for (let x = startX ; x < startX + canvasWidth ; x += 20 / canvasWidth) {
      let y = waveHeight * Math.sin((startX + x) * waveWidth + xOffset)
      y += canvasHeight / 2 - yOffset // 添加垂直偏移量
      points.push([x, y])
      ctx.lineTo(x, y)
    }
    ctx.lineTo(canvasWidth, canvasHeight)
    ctx.lineTo(startX, canvasHeight)
    ctx.lineTo(...points[0])
    ctx.stroke()
    ctx.fill()
  }
}

到此就大功告成啦!
结语
本篇作为 Canvas 实战开篇,简单时间了一个水波图,后续将继续挑战其他更复杂的图形。


 1064
1064


 被折叠的 条评论
为什么被折叠?
被折叠的 条评论
为什么被折叠?
 到【灌水乐园】发言


