


Question
Researchers undertook a meta-analysis of the effects of home monitoring on blood pressure. Randomised controlled trials were included if participants had essential hypertension and were trying to achieve blood pressure targets. The participants who did home blood pressure monitoring used ambulatory monitors. The control intervention was standard blood pressure monitoring in the healthcare system. In total, 13 randomised controlled trials were identified, with length of intervention ranging from two months to three years.
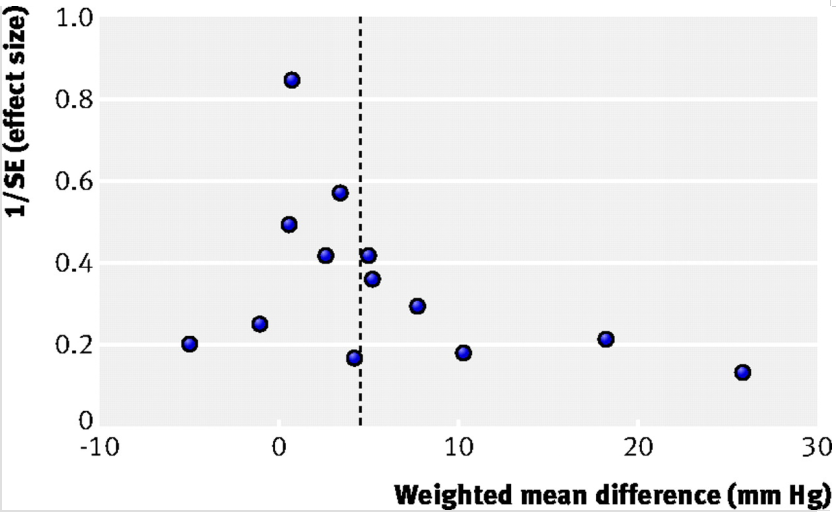
Primary outcome measures included the difference between treatment arms in mean systolic blood pressure. It was reported that home blood pressure monitoring resulted in lower systolic blood pressure than standard monitoring, with an overall mean difference of 4.2 mm Hg (95% confidence interval 1.5 to 6.9 mm Hg). A funnel plot was presented (figure⇓). The funnel plot displayed asymmetry, and Egger’s test gave a statistically significant result (P=0.038).
Funnel plot for the meta-analysis of the effects of home blood pressure monitoring on systolic blood pressure in comparison with standard monitoring.
Which of the following may have led to asymmetry in the funnel plot?
·a) Publication bias.
·b) Language bias.
·c) Citation bias.
·d) Poor methodological design in the trials.
提示:正确答案不止一个。
Answer
Answers a, b, c, and d may all have caused asymmetry in the funnel plot.
The meta-analysis compared the effects on blood pressure of home monitoring with standard monitoring in the healthcare system. However, the results may have been biased if not all the relevant trials were identified. Inappropriate treatment decisions could be made if the evidence was incomplete. The funnel plot is a graphical aid used to establish whether all relevant trials had been identified and included in the meta-analyses—or if bias had occurred and influenced which trials were included.
The funnel plot is a scatter plot of the estimated treatment effect for each trial against a measure of the precision of the estimated effect. For the above meta-analysis the mean difference between treatments in systolic blood pressure for each trial is plotted (on the horizontal axis) against the reciprocal of the standard error of the estimated treatment effect (on the vertical axis).
Trials with smaller sample sizes produce less precise estimates of the population treatment effect. As sample size increases and approaches the population size, the estimates increase in precision as they approach the value of the population treatment effect. As the precision of the estimated treatment effect increases with increasing sample size, the standard error of the estimate decreases in magnitude. Therefore, the reciprocal of the standard error of the estimate increases as the precision of the estimate increases. As the precision of the estimates increase with increasing sample size—as indicated by larger values of the reciprocal of the standard error—the variation between treatment estimates will decrease as they approach the population treatment effect in magnitude. The scatter of points on the funnel plot shown are therefore expected to be symmetrical in shape around the mean estimated treatment effect, resembling an inverted funnel shape with the widest part on the horizontal axis.
Sometimes an alternative measure of precision is used in a funnel plot, including the reciprocal of the sample size or the reciprocal of the variance of the estimated treatment effect.
If bias had occurred and influenced which trials were included in the meta-anlaysis, the funnel plot would be asymmetrical in shape—that is, the points will not resemble a funnel shape scattered equally around the mean estimated effect. Although the plot may detect bias, it is not possible to identify which biases are present.
Publication bias can lead to asymmetry in the funnel plot (answer a is true). Publication bias is the failure to include all relevant trials in the meta-analysis because they were not published and therefore not accessible. However, asymmetry in the funnel plot has often, wrongly, been attributed solely to publication bias. Other possible sources of asymmetry in funnel plots exist. These include other types of reporting bias, a broad encompassing term used to describe a group of biases that influence which trials are identified, of which publication bias is just one.
Language and citation biases are types of reporting bias, both known to cause asymmetry in funnel plots (answers b and c are true). Language bias is the selective inclusion of studies published typically only in English, as those published in other languages are not as easily accessible. When trials are identified, their reference lists are examined for other possible trials. This may result in citation bias, the tendency for the most frequently cited studies to be identified and included in the meta-analysis.
Asymmetry in the funnel plot may also have occurred because of poor methodological design in the trials (answer d is true).An example of poor study design is failure to conceal treatment allocation. In none of the trials in the above meta-analysis was it possible to conceal treatment allocation from patients, which may have led to response bias. Poor methodological design, typically a problem in trials with small sample sizes, can lead to spuriously inflated estimates of the treatment effect.
Inspection of the funnel plot indicates that asymmetry exists, although assessment is subjective. Generally funnel plots are considered unreliable methods of investigating publication bias, in particular if the number of studies is small. Statistical tests for detecting funnel plot asymmetry exist, including Egger’s test. The P value for Egger’s test in this meta-analysis was 0.038. Therefore, the null hypothesis is rejected in favour of the alternative at the 5% level of significance, with the conclusion that funnel plot asymmetry is present. Bias therefore occurred and influenced which trials were included in the meta-analysis.
所以答案是选择 a b c d
每天学习一点,你会更强大!


 821
821


 被折叠的 条评论
为什么被折叠?
被折叠的 条评论
为什么被折叠?
 到【灌水乐园】发言


