


MATLAB学习笔记(05 初阶绘图 Basic Plotting)
如果想获得更好浏览体验的朋友可以转到下面链接 05
1. plot()
plot(x,y);  %画出每个向量对(x,y)
plot(y);  %只给y,如果y是向量则软件会给x=[1:n]
2. hold on/off
需要在一张图上画两条曲线,需要用到 hold on/off
plot(cos(0:pi/20:2*pi));
plot(sin(0:pi/20:2*pi));
%只能得到最后画出的曲线

hold on
plot(cos(0:pi/20:2*pi));
plot(sin(0:pi/20:2*pi));
hold off
%在一张图上得到两条曲线

3. plot style
plot(x,y,‘str’) 将会使用在 str 定义中的格式画出每个向量对。

hold on
plot(cos(0:pi/20:2*pi),'or--' );  %表示marker为圆圈 (o) ,marker的颜色为红色 (r) ,线形为虚线 (--)
plot(sin(0:pi/20:2*pi));
hold off

4. legend()
在坐标区上添加图例
x=0:0.5:4*pi;
y=sin(x);
h=cos(x);
w=1./(1+exp(-x));
g=(1(2*pi*2)^0.5).*exp((-1.*(x-2*pi).^2)./(2*2^2));

plot(x,y,'bd-',x,h,'gp:',x,w,'ro-',x,g,'c^-');

legend('sin(x)','cos(x)','Sigmoid','Gauss function');  %产生figure中右上角的图例

5. title() 和 label()
title() 添加图题
xlabel() 为 x 轴添加标签
x = 0:0.1:2*pi;
y1 = sin(x);
y2 = exp(-x);
plot(x, y1, '--*', x, y2, ':o');
xlabel('t = 0 to 2\pi');  %为X轴添加标题
ylabel('values of sin(t) and e^{-x}'); %为Y轴添加标题
title('Function Plots of sin(t) and e^{-x}');  %添加图题
legend('sin(t)','e^{-x}');  %添加图例

6. text() 和 annotation()
text(x,y,txt) 使用由 txt 指定的文本,向当前坐标区中的一个或多个数据点添加文本说明。
annotation(lineType,x,y) 创建一个在当前图窗中的两个点之间延伸的线条或箭头注释。将 lineType 指定为 ‘line’、‘arrow’、‘doublearrow’ 或 ‘textarrow’。将 x 和 y 分别指定为 [x_begin, x_end] 和 [y_begin, y_end] 形式的二元素向量
x = linspace(0,3);
y = x.^2.*sin(x);
plot(x,y);
line([2,2],[0,2^2*sin(2)]);

str = '$$ \int_{0}^{2} x^2\sin(x) dx $$';  %积分运算的Latex代码

text(0.25,2.5,str,'Interpreter','latex');  %在点 (0.25, 2.5) 上添加积分运算的文本说明

annotation('arrow','X',[0.32,0.5],'Y',[0.6,0.4]);  %在 (0.32, 0.6) 到 (0.5, 0.4) 两点之间延伸到箭头注释

P11 exercise:
题目:在一张图上画出两条关于t=1 to 2 的曲线,其中线 f 为黑线,线 g 为红圈。
f
=
t
2
and
g
=
sin
(
2
π
t
)
f=t^{2} \quad \text { and } \quad g=\sin (2 \pi t)
f=t2 and g=sin(2πt)
同时,为每个坐标轴添加标签,图片增加图题和图例。
t=linspace(1,2);  %取1到2点100个等间距点作为一个行向量放到t中
f=t.^2;
g=sin(2\pi.*t);

hold on
plot(t,f, 'k');  %曲线f为黑线
plot(t,g,'or');  %曲线g为红圈
hold off

xlabel('t= 1 to 2');
ylabel('values of t^{2} and sin(2\pit)');

title('Function Plots of t^{2} and sin(2\pit)');

legend('t^{2}','sin(2 \pi t)');

%clf命令为清除当前图像窗口中的内容

7. Modifying Properties of Object
P15 exercise:
运行代码:
x = linspace(0, 2*pi, 1000); y = sin(x);
plot(x,y); set(gcf, 'Color', [1 1 1]);  %gcf为图形的句柄,[1 1 1]表示RGB三色的比例
得到的figure如下:

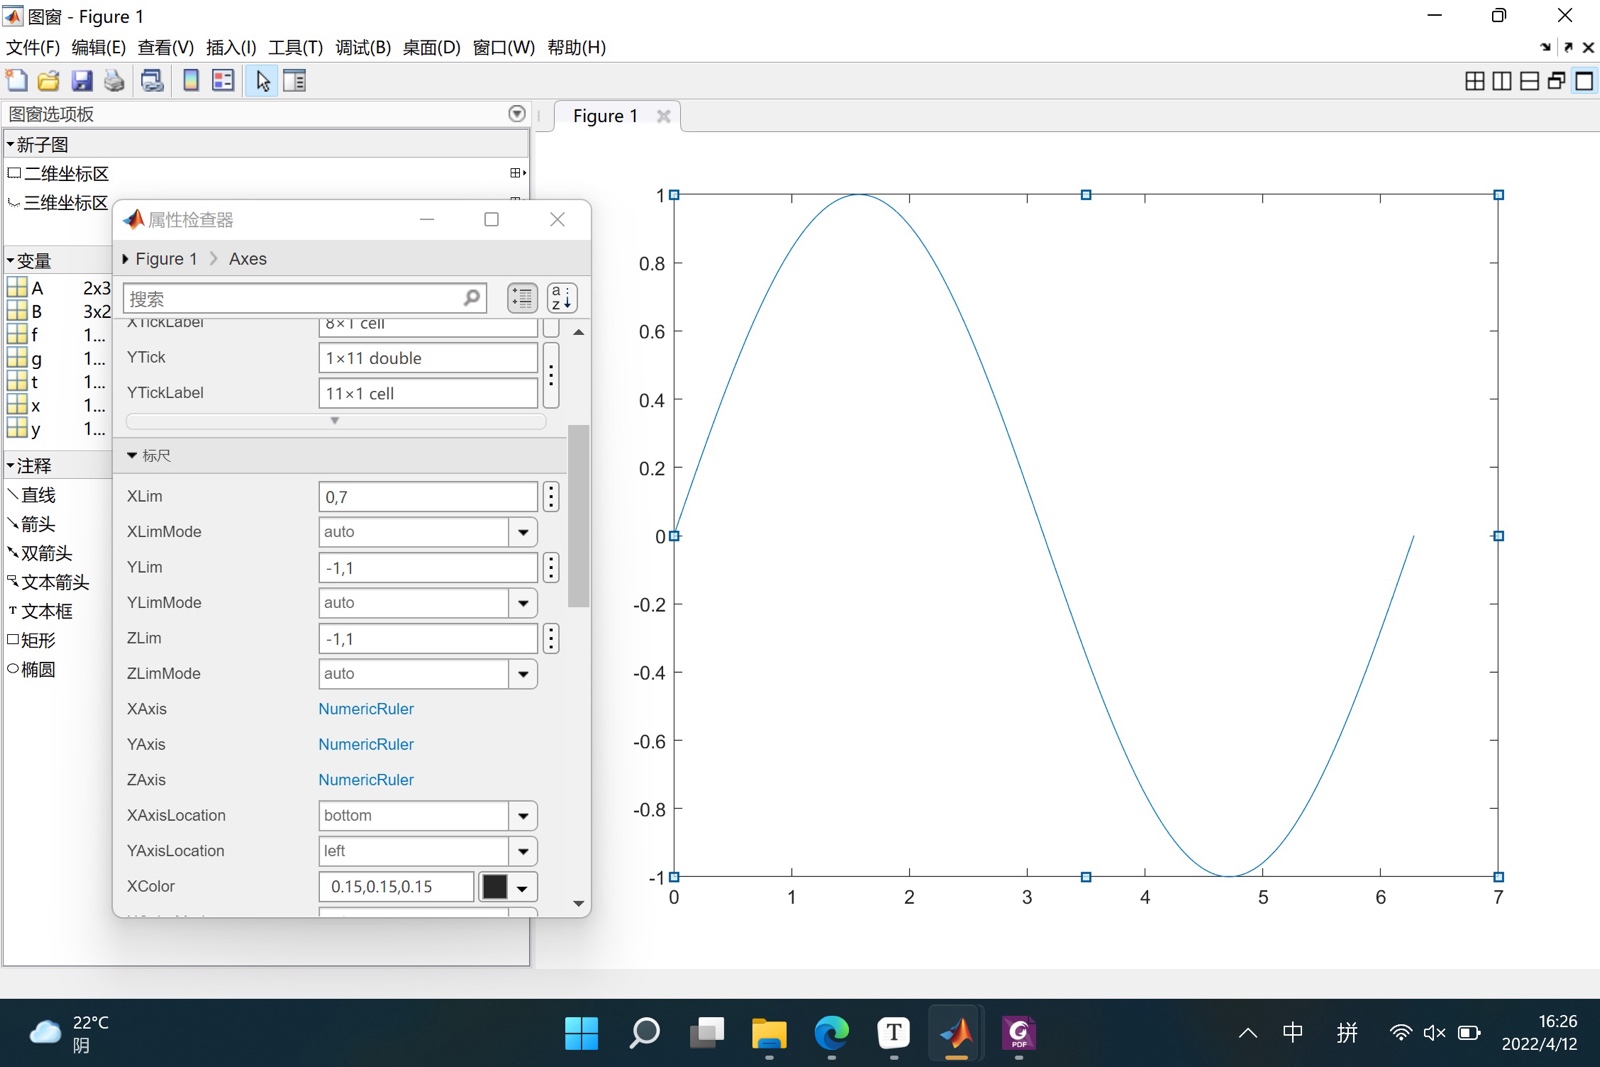
可在图窗-查看-属性检查器中查看每个 object 的 handle 并修改。(object 包括 figure object、line object、axis object)
效果图如下:
8. 识别一个 object 的 handle

- 实用函数
| Function | Purpose |
|---|---|
| gca | Return the handle of the “current” axes |
| gcf | Return the handle of the “current” figure |
| allchild | Find all children of specified objects |
| ancestor | Find ancestor of graphics object |
| delete | Delete an object |
| findall | Find all graphics objects |
9. 取回和修改object中的参数
%get():取回object中的参数
x = linspace(0, 2*pi, 1000);
y = sin(x);
h = plot(x,y);
get(h)  %得到线h的参数,使用时需要注意句柄指向的对象是否存在,如果指向的曲线不存在,则会显示 "Invalid or deleted object." 。

>> Class_5
    AlignVertexCenters: off
            Annotation: [1×1 matlab.graphics.eventdata.Annotation]
          BeingDeleted: off
            BusyAction: 'queue'
         ButtonDownFcn: ''
              Children: [0×0 GraphicsPlaceholder]
%........
%省略很多参数
get(gca);  %得到坐标轴的参数

>> Class_5
                        ALim: [0 1]
                    ALimMode: 'auto'
                  AlphaScale: 'linear'
                    Alphamap: [0 0.0159 0.0317 0.0476 0.0635 … ]
           AmbientLightColor: [1 1 1]

%........
%省略很多参数
set(gca,'Xlim',[0, 2*pi]);  %设置X轴的范围
set(gca,'YLim',[-1.2,1.2]);  %设置Y轴的范围
得到修改坐标轴参数后的图:

10. 设置坐标轴的字体和刻度轴(Font and Tick of Axis)
set(gca, 'FontSize', 25);  %设置坐标轴的字体大小
set(gca, 'XTick', 0:pi/2:2*pi);   %设置坐标轴刻度的范围(就是坐标轴上的短线)

%%下面两句命令未在图中表示,只是列举出来,在运行代码的时候需要删除
set(gca, 'XTickLabel', 0:90:360);  %设置坐标轴刻度的标签(短线下面的数字)
text(0.25,2.5,str,'Interpreter','latex');  %在点 (0.25,2.5) 上添加积分运算的文本说明
%%

set(gca,'TickLabelInterpreter','latex');  %经过查阅help文档得知,symbol模式已经不再使用,此处将TickLabel的值选为latex,设置的标签需要用latex格式表示。

set(gca, ’XTickLabel‘, {’0‘, ’$\pi/2$‘, ’$\pi$‘, ’$3\pi/2$‘,’$2\pi$‘} );  %用latex格式表示0, pi/2, pi 等

11. 设置线的参数
set(h, 'LineStyle', '-.','LineWidth', 7.0, 'Color', 'g'); %设置线h的类型为点划线,线宽为7.0,颜色为绿色

delete(h); %figure中将没有线h,但是仍有axis和figure
12. 标记点的参数 (Marker Specification)
x=rand(20,1);  %得到在区间 (0,1) 内均匀分布的数字所组成的20*1的矩阵

set(gca, 'FontSize', 18);

plot(x,'-md','LineWidth', 2, 'MarkerEdgeColor', 'k',...
'MarkerFaceColor', 'g', 'MarkerSize', 10);
%-md 表示实线、洋红色、菱形点,设置标记点Marker的边缘颜色为黑色 (k) ,标记点内部颜色为绿色 (g) ,标记点尺寸为 10 。

xlim([1, 20]);  %X轴的范围

P22 exercise:

要求:黑线变粗,红色的Marker face color为pink,坐标轴字体大小font size加大。
t= linspace(1, 2, 100);
y1= t.^2;
y2= sin(2*pi.*t);


hold on
plot(t, y1, 'k','LineWidth', 5);
plot(t, y2, 'or', 'MarkerFaceColor', [0 0 0.8],...
    				'MarkerSize', 10 );
hold off

xlabel('Time (ms) ');
ylabel('f(t)');
title('Mini Assignment #1');
legend('t^2', 'sin(2\pit)', 'location', 'northwest');

%以上完成了line和figure的基本内容,下面对图例和坐标轴的字体大小和坐标轴刻度进行调整

set(gca,'FontSize', 30,'Xtick', [1: 0.2: 2],'Ytick', [-1: 1: 4]);
效果图如下:

13. 多图显示
x = -10:0.1:10; y1 = x.^2 - 8; y2 = exp(x);
figure, plot(x,y1);  %两次figure可以画出两幅图
figure, plot(x,y2);
figure('Position', [left, bottom, width, height]); %设置figure的位置
设置规则如下:

subplot(m, n,1); %subplot表示在一张图上表示多个小图,其中 m 为小图的行数,n 为小图的列数,1 为小图的顺序。

t = 0:0.1:2*pi;
x = 3*cos(t);
y = sin(t);
subplot(2, 2, 1); plot(x, y); axis normal
subplot(2, 2, 2); plot(x, y); axis square  %XY轴为等长的坐标轴,刻度不一定相等
subplot(2, 2, 3); plot(x, y); axis equal   %XY轴使用等长的刻度,长度一定相等
subplot(2, 2, 4); plot(x, y); axis equal tight  %数据范围是坐标轴刻度范围,得到的图片坐标轴与图形相切

14. Control Grid, Box, and Axis
Gird: 坐标区的网格
Box: 坐标区轮廓(似乎只有三维坐标系中才有)
| 函数名称 | 内容 |
|---|---|
| grid on/off | Make the grid visible or invisible |
| box on/off | Make the box visible or invisible |
| axis on/off | Make the axes visible or invisible |
| axis normal | Automatically adjust the aspect ratio of the axes and the relative scaling of the data units |
| axis square | Make the current axes region square |
| axis equal | Set the aspect ratio so that the data units are the same in every direction |
| axis equal tight | Set the axis limits to the range of the data |
| axis image | Let the plot box fits tightly around the data |
| axis ij | Place the origin of the coordinate system in the |
| upper | left corner |
| axis xy | Place the origin in the lower left corner |
15. 保存图片为文件
表达式:
saveas(gcf,'<filename>','<formattype>');
| Option | Bitmap Image Format |
|---|---|
| ‘jpeg’ | JPEG 24-bit |
| ‘png’ | PNG 24-bit |
| ‘tiff’ | TIFF 24-bit (compressed) |
| ‘bmpmono’ | BMP Monochrome |
| ‘bmp’ | BMP 24-bit |
| ‘bmp256’ | BMP 8-bit (256 color, uses a fixed colormap) |
| Option | Vector Graphics Format |
|---|---|
| ‘pdf’ | Full page Portable Document Format (PDF) color |
| ‘eps’ | Encapsulated PostScript (EPS) Level 3 black and white |
| ‘epsc’ | Encapsulated PostScript (EPS) Level 3 color |
| ‘meta’ | Enhanced Metafile (Windows only) |
| ‘svg’ | SVG (scalable vector graphics) |
| ‘ps’ | Full-page PostScript (PS) Level 3 black and white |
| ‘psc’ | Full-page PostScript (PS) Level 3 color |


 5919
5919


 被折叠的 条评论
为什么被折叠?
被折叠的 条评论
为什么被折叠?
 到【灌水乐园】发言


