


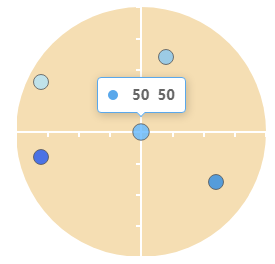
echart散点图,原点是(50,50)
效果图
<div style="height:250px;width:250px;background: wheat;border-radius: 50%">
	<div  :id="scatter" style="height:250px;width:250px"></div>
</div>
        initBar() {

            // 基于准备好的dom,初始化echarts实例
            let myChart = this.$echarts.init(document.getElementById('scatter'));
            this.$echarts.registerTransform(ecStat.transform.clustering);
            const data = [[80, 30],[50,50],[60,10]];
            var CLUSTER_COUNT = 6;
            var DIENSIION_CLUSTER_INDEX = 2;
            var COLOR_ALL = [
                '#2056F1',
            ];
            var pieces = [];
            for (var i = 0; i < CLUSTER_COUNT; i++) {
                pieces.push({
                    value: i,
                    label: 'cluster ' + i,
                    color: COLOR_ALL[i]
                });
            }

            // 绘制图表
            myChart.setOption({
                dataset: [
                    {
                        source: data
                    },
                    {
                        transform: {
                            type: 'ecStat:clustering',
                            // print: true,
                            config: {
                                clusterCount: CLUSTER_COUNT,
                                outputType: 'single',
                                outputClusterIndexDimension: DIENSIION_CLUSTER_INDEX
                            }
                        }
                    }
                ],
                tooltip: {
                    position: 'top'
                },
                visualMap: {
                    type: 'piecewise',
                    top: 'middle',
                    min: 0,
                    max: CLUSTER_COUNT,
                    left: 10,
                    splitNumber: CLUSTER_COUNT,
                    dimension: DIENSIION_CLUSTER_INDEX,
                    pieces: pieces,
                    show: false, //图例显示与隐藏
                },
                grid: {
                    // left: 120
                    // show: true,
                    height: 250,
                    width: 250,
                    x: 0,
                    y2: 0

                },
                xAxis: {
                    max: 100,
                    min: 0,
                    interval: 12.5,
                    splitLine: {
                        show: false,
                    },

                    axisLine: {
                        show: true,
                        onZero: false,
                        // 阴影水平方向偏移
                        lineStyle: {
                            shadowOffsetX: 0,
                            shadowOffsetY: -125,
                            shadowColor: "#FFF",
                            width: 2,
                            color: '#fff',
                        }
                    },
                    // 刻度
                    axisTick: {
                        lineStyle: {
                            shadowOffsetY: -125,
                            shadowColor: "#FFF",
                            width: 2,

                        }
                    },

                },
                yAxis: {

                    max: 100,
                    min: 0,
                    interval: 12.5,
                    splitLine: {
                        show: false
                    },
                    // 阴影垂直方向偏移
                    axisLine: {
                        show: true,
                        onZero: false,
                        lineStyle: {
                            shadowOffsetX: 125,
                            shadowOffsetY: 0,
                            shadowColor: "#FFF",
                            width: 2,
                            color: '#fff',
                        }
                    },
                    // 刻度
                    axisTick: {
                        lineStyle: {
                            shadowOffsetX: 125,
                            shadowColor: "#FFF",
                            width: 2
                        }
                    },

                },
                series: {
                    type: 'scatter',
                    encode: { tooltip: [0, 1] },
                    symbolSize: 15,
                    itemStyle: {
                        borderColor: '#555'
                    },
                    datasetIndex: 1
                },

            });
        },


 5537
5537


 被折叠的 条评论
为什么被折叠?
被折叠的 条评论
为什么被折叠?
 到【灌水乐园】发言


