


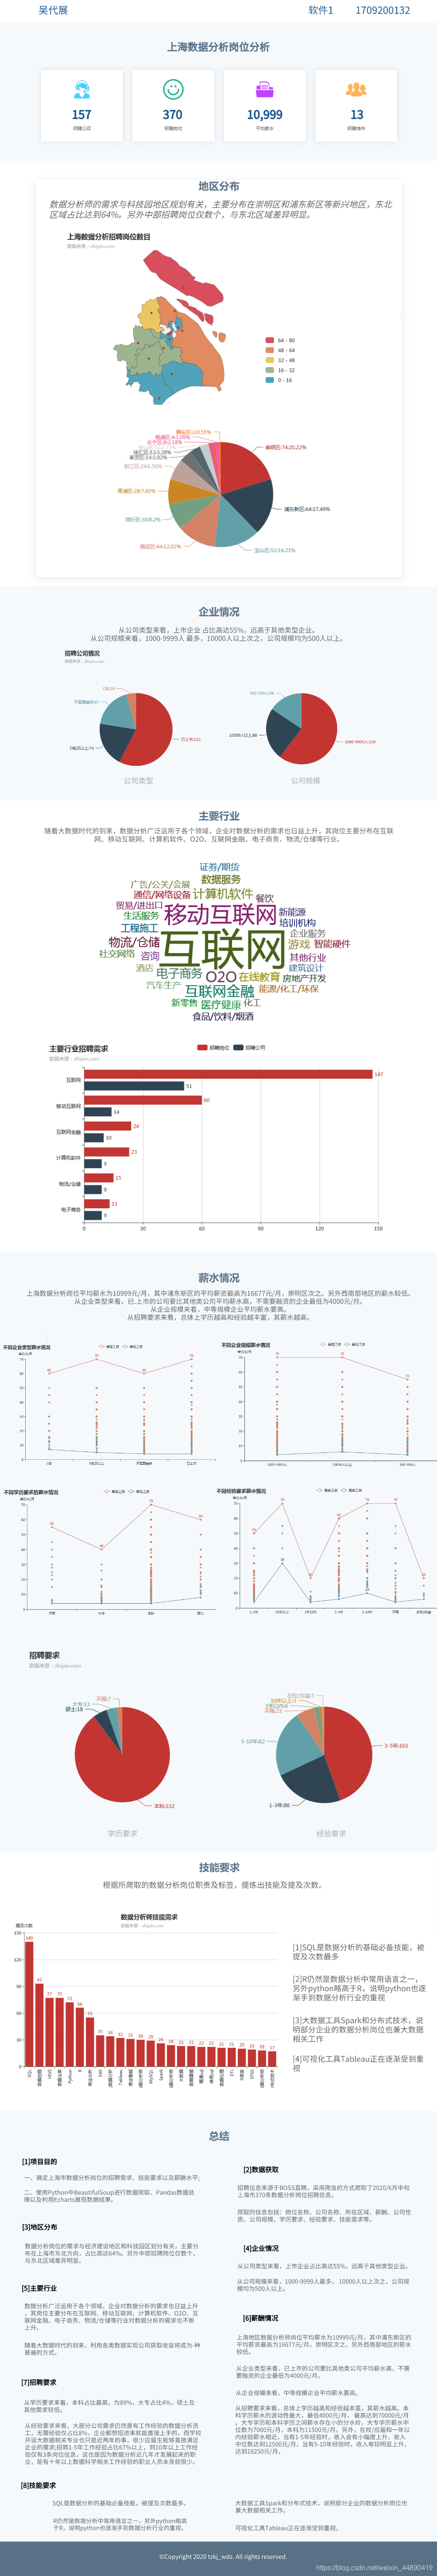
先看结果
代码
在运行之前需要做几个准备:
1、去boss里面抓包china.json
2、下载和安装Chromedriver
3、ip被封了自己找高匿ip换
不会就百度
爬虫部分
#!/usr/bin/env python3
from bs4 import BeautifulSoup
from selenium import webdriver
import json
import os
import urllib.parse as parse

#解析网页
def getResponseContent(url):
    proxy = "223.244.166.186:3828"  #自主添加高匿ip,绕过反爬
    chromeOptions = webdriver.ChromeOptions()   #模拟浏览器进入,同上
    chromeOptions.add_argument('--proxy-server=http://' + proxy)
    driver = webdriver.Chrome()
    driver.binary_location = r'C:\Users\Administrator\AppData\Local\Google\Chrome\Application\chrome.exe'  #谷歌浏览器地址
    driver.get(url)
    html = driver.page_source
    driver.quit()  #关闭浏览器,减少内存消耗
    return html

#获取城市id
def getCityid(CITY):
    # 读取json文件
    with open(os.path.join(os.path.dirname(__file__), './china.json'), 'r', encoding='utf-8') as  f:
        china_list = json.loads(f.read())['zpData']
    city_dict = {}
    for province in china_list['cityList']:
        for city in province['subLevelModelList']:
            city_dict[city['name']] = str(city['code'])
    # 生成全国城市json文件
    with open(os.path.join(os.path.dirname(__file__), 'city.json'), 'w', encoding='utf-8') as  f:
        f.write(str(city_dict).replace('\'', '"'))
    # 查询城市id
    with open(os.path.join(os.path.dirname(__file__), 'city.json'), 'r', encoding='utf-8') as f:
        city_dict = json.loads(f.read())
    return city_dict[CITY]

#根据输入的搜索信息获取各页网址
def getUrls(urlHead, urlEnd):
    name = input('请输入需要查询的职位:')
    city = input('请输入需要查询的城市:')
    name = parse.quote(name)
    cityid = getCityid(city)
    htmlurl = urlHead + cityid + urlEnd + name
    # 获取所有页数的url,boss中未登录用户只能获取14页数据
    url_ls = []
    for i in range(1, 14):#15
        url = htmlurl + '&page=' + str(i)
        url_ls.append(url)
        print('添加该页:%s 到URLS列表' % url)
    return url_ls

#解析网址内容,爬取有用信息,写入列表
def get_info(urls):
    items = []
    for url in urls:
        print("**********************")
        htmlContent = getResponseContent(url)
        items = []
        soup = BeautifulSoup(htmlContent, 'html.parser')
        tags = soup.find_all('div',attrs={'class': 'job-primary'})
        for tag in tags:
            item = {}
            item['position'] = tag.find('span',attrs={'class':'job-name'}).get_text()
            tags1 = tag.find('div', attrs={'class': 'info-company'})
            item['name'] = tags1.find('h3', attrs={'class': 'name'}).get_text()
            item['industry'] = tags1.find('a', attrs={'class': 'false-link'}).get_text()
            item['scale'] = tags1.find('div', attrs={'class': 'company-text'}).get_text().split('\n')[2]
            item['hr'] = tag.find('h3',attrs={'class':'name'}).get_text()
            item['address'] = tag.find('span', attrs={'class': 'job-area'}).get_text()
            item['keyword'] = ','.join(tag.find('div', attrs={'class': 'tags'}).get_text().split('\n'))
            item['welfare'] = tag.find('div', attrs={'class': 'info-desc'}).get_text()
            item['experience'] = tag.find('div', attrs={'class': 'job-limit clearfix'}).get_text().split('\n')[2]
            item['wages'] = tag.find('span', attrs={'class': 'red'}).get_text()
            item['Link'] = 'https://www.zhipin.com/'+tag.find('div', attrs={'class': 'primary-box'}).get('href')
            items.append(item)
            print('获取公司名为:<<%s>>' % (item['name']))
    return items

def write_json(items):
    # 写进json文件
    with open('BOSS直聘.json', 'w', encoding='utf-8') as f:
        json.dump(items, f, ensure_ascii=False, indent=4)

if __name__ == '__main__':
    url_head = 'https://www.zhipin.com/c'
    url_end = '/?query='
    urls = getUrls(url_head, url_end)
    info = get_info(urls)
    write_json(info)
数据处理和可视化部分
import pandas as pd

df = pd.read_json('BOSS直聘.json', encoding="utf-8")
#df.to_csv('BOSS直聘.csv',index=None,mode='a')

#划分上海个各区
address = df['address'].str.split('·',1).str[1]  #剔除没有标明区的数据
address = address.str.split().apply(pd.Series)
address = address.apply(lambda x:x.value_counts()).fillna('0').astype(int)
address = address.apply(lambda x:x.sum(),axis=1)
address = pd.DataFrame(address,columns=['counts'])   #转换为dataframe
address.reset_index(level=0, inplace=True)  #添加索引
#print(address)


#删除多余信息,提取公司规模信息
scale = df.apply(lambda x: x['scale'].split(x['industry'],1),axis=1)
scale= scale.apply(lambda x: x[1:])
scale= scale.apply(lambda x: ''.join(x))
#print(scale)

#把公司类型和人数分离
#公司类型
scale2 = df['scale'].str.split('1',1).str[1]
type = scale.str.split('1',1).str[0]
type = type.str.split('5',1).str[0]
type1 = type   #用于薪资分析
type = type.apply(pd.Series)
type = type.apply(lambda x:x.value_counts()).astype(int)
type = type.apply(lambda x:x.sum(),axis=1)
type = pd.DataFrame(type,columns=['counts'])
type.reset_index(level=0, inplace=True)
#print(type)

#公司人数
scale2= scale2.apply(pd.Series)
scale2= scale2.where((scale2.applymap(
    lambda x: True if str(x) != 'nan' else False)), '500-999人')
scale2= scale2.where((scale2.applymap(
    lambda x: True if str(x) != '000-9999人' else False)), '1000-9999人')
scale2= scale2.where((scale2.applymap(
    lambda x: True if str(x) != '0000人以上' else False)), '10000人以上')
scale3 = scale2  #用于薪资分析
scale2= scale2.apply(lambda x:x.value_counts()).astype(int)
scale2= scale2.apply(lambda x:x.sum(),axis=1)
scale2 = pd.DataFrame(scale2,columns=['counts'])
scale2.reset_index(level=0, inplace=True)
#print(scale2)


#求职技能关键字重塑
keyword = df['keyword'].str.split(',').apply(pd.Series)
keyword = keyword.apply(lambda x:x.value_counts()).fillna('0').astype(int)
keyword = keyword.apply(lambda x:x.sum(),axis=1)
keyword = pd.DataFrame(keyword,columns=['counts'])
keyword = keyword.drop([''])  #剔除无用数据
keyword = keyword.sort_values('counts',ascending=False)  #排序
keyword = keyword.head(25)
keyword.reset_index(level=0, inplace=True)
#print(keyword)


#对学历和经验进行分割
#学历
df['education'] = df['experience'].str[-2:]
education = df['education'].apply(pd.Series)
education1 = education #用于薪资分析
education = education.apply(lambda x:x.value_counts()).fillna('0').astype(int)
education = education.apply(lambda x:x.sum(),axis=1)
education = pd.DataFrame(education,columns=['counts'])
education.reset_index(level=0, inplace=True)
#print(education)

#工作经验
experience = df.apply(lambda x: x['experience'].split(x['education'],1),axis=1)
experience = experience.str[0:]
experience = experience.apply(lambda x: ''.join(x)).apply(pd.Series)
experience1 = experience #用于薪资分析
experience = experience.apply(lambda x:x.value_counts()).fillna('0').astype(int)
experience = experience.apply(lambda x:x.sum(),axis=1)
experience = pd.DataFrame(experience,columns=['counts'])
experience.reset_index(level=0, inplace=True)
#剔除无用数据
experience =experience[~experience['counts'].isin([1,2])]
#print(experience)


#薪资数据处理分析
wages = df['wages'].str.split('·',1).str[0]
wages = wages.apply(pd.Series)
wages = wages.apply(lambda x:x.value_counts()).fillna('0').astype(int)
wages = wages.apply(lambda x:x.sum(),axis=1)
wages = pd.DataFrame(wages,columns=['counts'])
wages.reset_index(level=0, inplace=True)
#print(wages)

#获取最高和最低工资
wages1 = pd.DataFrame()
wages1['min'] = wages['index'].str.split('-',1).str[0]
wages1['max'] = wages['index'].str.split('-',1).str[1].str[:-1]
wages1['type'] = type1
print(wages1)
#剔除工资为单位为天的数据
aaa = wages1['min'].apply(pd.Series).astype(int)
aaa = aaa.where((aaa.applymap(
    lambda x: True if x < 100 else False)), 'N')
wages1['min'] = aaa
wages1 =wages1[~wages1['min'].isin(['N'])]
#print(wages1)

#不同企业类型薪资情况
min1 = wages1.groupby(by=['type']).agg({'min':min})
wages1['max'] = wages1['max'].apply(pd.Series).astype(int)
max1 = wages1.groupby(by=['type']).agg({'max':max})
min1.reset_index(level=0, inplace=True)
max1.reset_index(level=0, inplace=True)
#print(wages1)

#不同企业规模薪资情况
wages1['scale'] = scale3
min2 = wages1.groupby(by=['scale']).agg({'min':min})
max2 = wages1.groupby(by=['scale']).agg({'max':max})
min2.reset_index(level=0, inplace=True)
max2.reset_index(level=0, inplace=True)
#print(max2)

#不同学历要求的薪资情况
wages1['education'] = education1
min3 = wages1.groupby(by=['education']).agg({'min':min})
max3 = wages1.groupby(by=['education']).agg({'max':max})
min3.reset_index(level=0, inplace=True)
max3.reset_index(level=0, inplace=True)

#不同经验要求的薪水情况
wages1['experience'] = experience1
min4 = wages1.groupby(by=['experience']).agg({'min':min})
max4 = wages1.groupby(by=['experience']).agg({'max':max})
min4.reset_index(level=0, inplace=True)
max4.reset_index(level=0, inplace=True)


#公司、岗位及所在区关系
df['add'] = 1  #增加一个全为1的列用于计数
position = df.groupby(by=['position']).agg({'add':sum})
position = position.sort_values('add',ascending=False)
#print(position)
name = df.groupby(by=['name']).agg({'add':sum})
name = name.sort_values('add',ascending=False)
#print(name)

#公司行业统计
industry = df['industry'].apply(pd.Series)
industry = industry.apply(lambda x:x.value_counts()).fillna('0').astype(int)
industry = industry.apply(lambda x:x.sum(),axis=1)
industry = pd.DataFrame(industry,columns=['counts'])
industry.reset_index(level=0, inplace=True)
#print(industry)

#各行业招聘岗位需求数
industry1 = df.groupby(by=['industry']).agg({'position':'count'})
industry1 = industry1.sort_values('position',ascending=False)
industry1.reset_index(level=0, inplace=True)
industry1 = industry1.head(6).sort_values('position',ascending=True)
#print(industry1)

#各行业公司需求数
industry2 = df.drop_duplicates(subset=[ 'name' ], keep ='first')
industry2 = industry2.groupby(by=['industry']).agg({'name':'count'})
industry2 = industry2.sort_values('name',ascending=False)
industry2.reset_index(level=0, inplace=True)
industry2 = industry2.head(6).sort_values('name',ascending=True)
#print(industry2)


from pyecharts import options as opts
from pyecharts.charts import *

def echarts_industry_wc():
    wc = WordCloud()
    wc.add("",
           list(zip(industry['index'],industry['counts'])),
           word_size_range=[20,100],
           shape='diamond')
    wc.set_global_opts(title_opts=opts.TitleOpts(title="数据分析主要行业"))
    wc.render('./html/echarts_industry_wc.html')
echarts_industry_wc()

#主要行业招聘需求
def echarts_industry_bar():
    bar = Bar()
    bar.add_xaxis(industry2['industry'].tolist())
    bar.add_yaxis("招聘岗位", industry1['position'].tolist())
    bar.add_yaxis("招聘公司", industry2['name'].tolist())
    bar.set_global_opts(title_opts=opts.TitleOpts(title="主要行业招聘需求",
                                                  subtitle="数据来源:zhipin.com"),
                        # 添加分割线
                        xaxis_opts=opts.AxisOpts(
                            splitline_opts=opts.SplitLineOpts(is_show=True)))
    # 系列配置项
    bar.set_series_opts(label_opts=opts.LabelOpts(position="right"))
    bar.reversal_axis()  # 翻转xy轴
    bar.render("./html/echarts_industry_bar.html")
#echarts_industry_bar()


city = ["崇明区", "浦东新区", "宝山区", "嘉定区", "闵行区", "青浦区",
        "松江区", "奉贤区", "徐汇区", "金山区", "长宁区", "杨浦区",
        "静安区", "普陀区", "虹口区", "黄浦区"]
#由于被剔除没有标明区的数据占总数据一半,此处按比例分配给各区
address['counts'] = address['counts'] * 2
def echarts_address_map():
    mp = Map()
    mp.add("map", list(zip(city, address['counts'].tolist())), "上海",
          label_opts=opts.LabelOpts(is_show=False))
    mp.set_global_opts(
        title_opts=opts.TitleOpts(title="上海数据分析招聘岗位数目",
                                  subtitle="数据来源:zhipin.com",pos_left="20%"),
        visualmap_opts=opts.VisualMapOpts(min_=0,max_=80,is_piecewise=True),
        legend_opts=opts.LegendOpts(is_show=False))
    mp.render("./html/echarts_address_map.html")
#echarts_address_map()

def echarts_address_pie():
    pie = Pie()
    pie.add("",
            list(zip(city, address['counts'].tolist())),
            center=["40%", "50%"],  # 饼图圆心位置
            radius=["0%", "50%"],  #内径外径
            )
    pie.set_global_opts(
        legend_opts=opts.LegendOpts(is_show=False))  # 不显示图例
    pie.set_series_opts(opts.LabelOpts(formatter="{b}:{c}:{d}%"))  # 饼图标签显示格式
    pie.render('./html/echarts_address_pie.html')
#echarts_address_pie()

def echarts_type_pie():
    pie = Pie(init_opts=opts.InitOpts(bg_color="#f5f9fc"))
    pie.add("",
            list(zip(type['index'].tolist(), type['counts'].tolist())),
            center=["25%", "50%"],  # 饼图圆心位置
            radius=["0%", "45%"],  #内径外径
            )
    pie.add("",
            list(zip(scale2['index'].tolist(), scale2['counts'].tolist())),
            center=["70%", "50%"],  # 饼图圆心位置
            radius=["0%", "45%"],  #内径外径
            )
    pie.set_global_opts(
        title_opts=opts.TitleOpts(title="招聘公司情况",
                                  subtitle="数据来源:zhipin.com"),
        legend_opts=opts.LegendOpts(is_show=False))  # 不显示图例
    pie.set_series_opts(opts.LabelOpts(formatter="{b}:{c}"))  # 饼图标签显示格式
    pie.render('./html/echarts_type_pie.html')
#echarts_type_pie()

def echarts_wages_len1():

    line = Line(init_opts=opts.InitOpts(bg_color="#f5f9fc"))
    line.add_xaxis(max1['type'].tolist())
    line.add_yaxis("最高工资", max1['max'].tolist())
    line.add_yaxis("最低工资", min1['min'].tolist())
    line.set_global_opts(title_opts=opts.TitleOpts(title="不同企业类型薪水情况"),
                         yaxis_opts=opts.AxisOpts(name="单位:K/月"))
    scatter = Scatter()
    scatter.add_xaxis(wages1['type'].tolist())
    scatter.add_yaxis("", wages1['min'].tolist(), symbol_size=7)  # 散点大小
    scatter.add_yaxis("", wages1['max'].tolist(), symbol_size=7)
    scatter.set_series_opts(label_opts=opts.LabelOpts(is_show=False))
    line.overlap(scatter)
    line.render("./html/line_wages_len1.html")
#echarts_wages_len1()

def echarts_wages_len2():
    line = Line(init_opts=opts.InitOpts(bg_color="#f5f9fc"))
    line.add_xaxis(max2['scale'].tolist())
    line.add_yaxis("最高工资", max2['max'].tolist())
    line.add_yaxis("最低工资", min2['min'].tolist())
    line.set_global_opts(title_opts=opts.TitleOpts(title="不同企业规模薪水情况"),
                         yaxis_opts=opts.AxisOpts(name="单位:K/月"))
    scatter = Scatter()
    scatter.add_xaxis(wages1['scale'].tolist())
    scatter.add_yaxis("", wages1['min'].tolist(), symbol_size=7)  # 散点大小
    scatter.add_yaxis("", wages1['max'].tolist(), symbol_size=7)
    scatter.set_series_opts(label_opts=opts.LabelOpts(is_show=False))
    line.overlap(scatter)
    line.render("./html/line_wages_len2.html")
#echarts_wages_len2()


def echarts_wages_len3():
    line = Line(init_opts=opts.InitOpts(bg_color="#f5f9fc"))
    line.add_xaxis(max3['education'].tolist())
    line.add_yaxis("最高工资", max3['max'].tolist())
    line.add_yaxis("最低工资", min3['min'].tolist())
    line.set_global_opts(title_opts=opts.TitleOpts(title="不同学历要求的薪水情况"),
                         yaxis_opts=opts.AxisOpts(name="单位:K/月"))
    scatter = Scatter()
    scatter.add_xaxis(wages1['education'].tolist())
    scatter.add_yaxis("", wages1['min'].tolist(), symbol_size=7)  # 散点大小
    scatter.add_yaxis("", wages1['max'].tolist(), symbol_size=7)
    scatter.set_series_opts(label_opts=opts.LabelOpts(is_show=False))
    line.overlap(scatter)
    line.render("./html/line_wages_len3.html")
#echarts_wages_len3()

def echarts_wages_len4():
    line = Line(init_opts=opts.InitOpts(bg_color="#f5f9fc"))
    line.add_xaxis(max4['experience'].tolist())
    line.add_yaxis("最高工资", max4['max'].tolist())
    line.add_yaxis("最低工资", min4['min'].tolist())
    line.set_global_opts(title_opts=opts.TitleOpts(title="不同经验要求薪水情况"),
                         yaxis_opts=opts.AxisOpts(name="单位:K/月"))
    scatter = Scatter()
    scatter.add_xaxis(wages1['experience'].tolist())
    scatter.add_yaxis("", wages1['min'].tolist(), symbol_size=7)  # 散点大小
    scatter.add_yaxis("", wages1['max'].tolist(), symbol_size=7)
    scatter.set_series_opts(label_opts=opts.LabelOpts(is_show=False))
    line.overlap(scatter)
    line.render("./html/line_wages_len4.html")
#echarts_wages_len4()

def echarts_education_pie():
    pie = Pie(init_opts=opts.InitOpts(bg_color="#f5f9fc"))
    pie.add("",
         list(zip(education['index'].tolist(), education['counts'].tolist())),
         center=["25%", "50%"],  # 饼图圆心位置
         radius=["0%", "45%"],  # 内径外径
         )
    pie.add("",
            list(zip(experience['index'].tolist(), experience['counts'].tolist())),
            center=["70%", "50%"],  # 饼图圆心位置
            radius=["0%", "45%"],  # 内径外径
            )

    pie.set_global_opts(
        title_opts=opts.TitleOpts(title="招聘要求",
                                  subtitle="数据来源:zhipin.com"),
        legend_opts=opts.LegendOpts(is_show=False))  # 不显示图例
    pie.set_series_opts(opts.LabelOpts(formatter="{b}:{c}"))  # 饼图标签显示格式
    pie.render('./html/echarts_education_pie.html')
#echarts_education_pie()

def echarts_keyword_bar():
    bar = Bar()
    bar.add_xaxis(keyword['index'].tolist())
    bar.add_yaxis("",keyword['counts'].tolist())
    bar.set_global_opts(title_opts=opts.TitleOpts(title="数据分析师技能需求",
                                                  subtitle="数据来源:zhipin.com",pos_left="40%"),
                        legend_opts=opts.LegendOpts(is_show=False),  # 不显示图例
                        xaxis_opts=opts.AxisOpts(
                            axislabel_opts=opts.LabelOpts(rotate=90)),
                        yaxis_opts=opts.AxisOpts(
                            splitline_opts=opts.SplitLineOpts(is_show=True),
                        name='提及次数'))
    bar.render("./html/echarts_keyword_bar.html")
#echarts_keyword_bar()
写在最后
个人觉得代码有点丑长,很多地方都可以优化改进,水平有限,仅供参考,各位轻喷!


 8227
8227

 被折叠的 条评论
为什么被折叠?
被折叠的 条评论
为什么被折叠?
 到【灌水乐园】发言


