from pyecharts import options as opts
from pyecharts.charts import HeatMap
from pyecharts.faker import Faker
import random
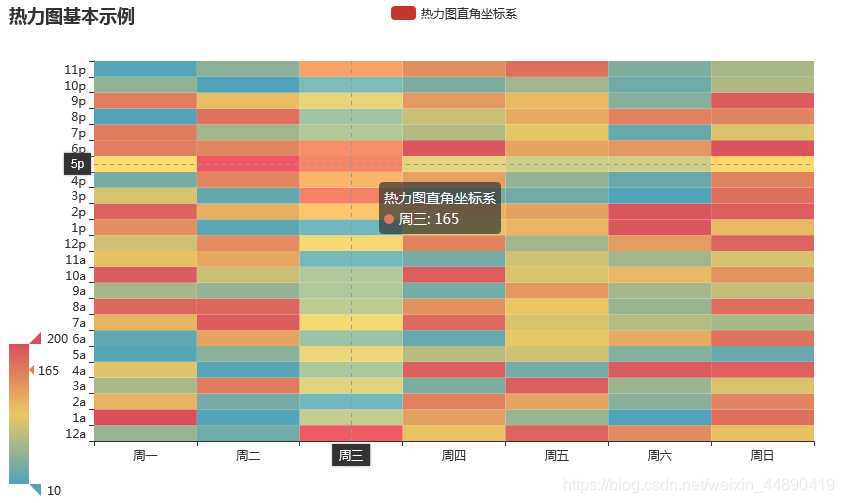
hm = HeatMap()# 使用列表表达式创建7*24的二维列表
data =[[i,j,random.randint(10,200)]for i inrange(7)for j inrange(24)]
hm.add_xaxis(Faker.week)
hm.add_yaxis("热力图直角坐标系",Faker.clock,data)
hm.set_global_opts(
title_opts=opts.TitleOpts(title="热力图基本示例"),
tooltip_opts=opts.TooltipOpts(axis_pointer_type="cross"),# 指示器类型
visualmap_opts=opts.VisualMapOpts(min_=10,max_=200))
hm.render("./html/heatmap_base.html")
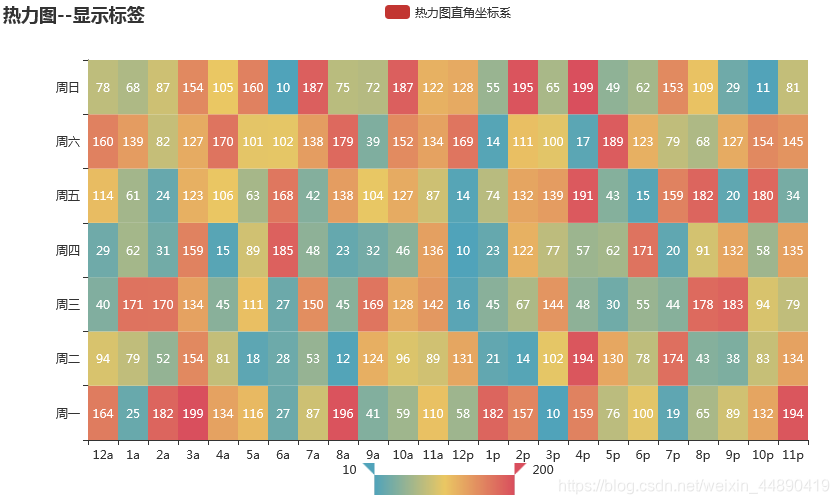
2、显示标签
from pyecharts import options as opts
from pyecharts.charts import HeatMap
from pyecharts.faker import Faker
import random
hm = HeatMap()# 使用列表表达式创建7*24的二维列表
data =[[i,j,random.randint(10,200)]for i inrange(24)for j inrange(7)]
hm.add_xaxis(Faker.clock)
hm.add_yaxis("热力图直角坐标系",Faker.week,data)
hm.set_global_opts(
title_opts=opts.TitleOpts(title="热力图--显示标签"),
visualmap_opts=opts.VisualMapOpts(
min_=10,max_=200,
orient="horizontal",# 视觉映射组件水平放置
pos_left="center"))#居中
hm.set_series_opts(label_opts=opts.LabelOpts(is_show=True,position="inside"))
hm.render("./html/heatmap_label.html")
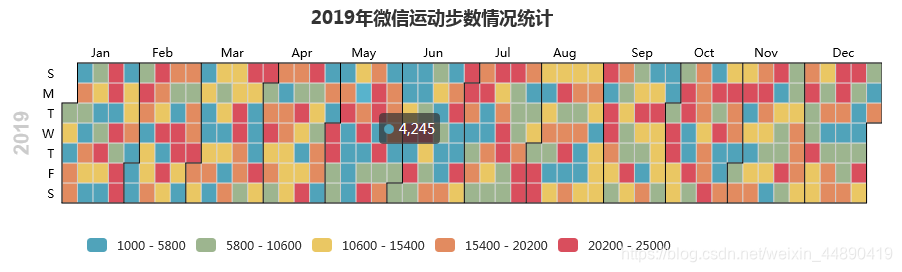
基本图表–日历图
from pyecharts.charts import Calendar
基本示例
from pyecharts import options as opts
from pyecharts.charts import Calendar
import pandas as pd
import random
data =[[i.strftime('%Y-%m-%d'), random.randint(1000,25000)]for i in pd.date_range('2019/1/1','2019/12/31')]
calendar = Calendar()
calendar.add("",data,calendar_opts=opts.CalendarOpts(range_="2019"))
calendar.set_global_opts(
title_opts=opts.TitleOpts(title="2019年微信运动步数情况统计", pos_left="center"),
visualmap_opts=opts.VisualMapOpts(
min_=1000,
max_=25000,
orient="horizontal",# 水平放置visualMap组件
is_piecewise=True,# visualMap分段
pos_left="100px",# visualMap 组件离容器左侧的距离
pos_top="230px"# visualMap 组件离容器右侧的距离))
calendar.render("./html/calendar_test.html")


 2646
2646


 被折叠的 条评论
为什么被折叠?
被折叠的 条评论
为什么被折叠?
 到【灌水乐园】发言


