


1,读取txt文件实现数据可视化
2,txt文件如下图
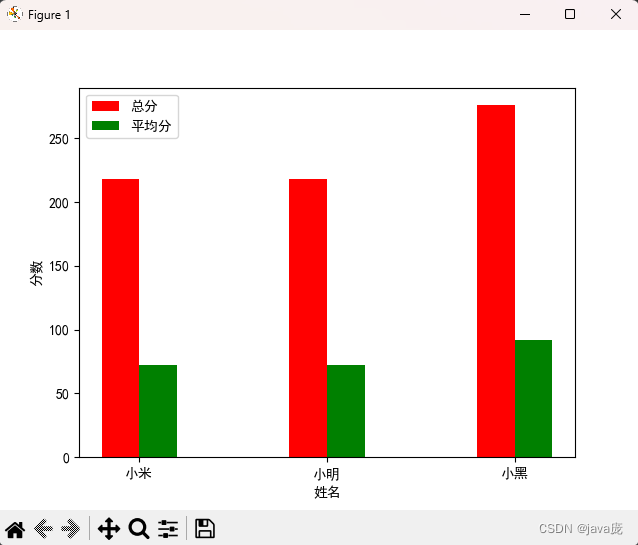
姓名,语文,数学,英语
小米,98,100,20
小明,100,20,98
小黑,78,98,100
3,代码如下
import matplotlib.pyplot as plt
import matplotlib
matplotlib.use('TkAgg')
plt.rcParams['font.family']='SimHei'
plt.rcParams['font.sans-serif']=['SimHei']

# 定义x轴
x = []
# 定义y轴
total_y = []
avg_y = []


list_all = []

# 读取文件
file = open('student.txt','r',encoding='UTF-8').readlines()
for msg in range(1,4):
    student_info = file[msg].replace("\n","")
    stu_list = student_info.split(",")
    list_all.append(stu_list)
print(list_all)
for stu in range(3):
    x.append(list_all[stu][0])
    total_y.append(int(list_all[stu][1])+int(list_all[stu][2])+int(list_all[stu][3]))
    avg_y.append((int(list_all[stu][1]) + int(list_all[stu][2]) + int(list_all[stu][3]))//3)
print(x)
print(total_y)
print(avg_y)
# 每个柱形图的宽度
width = 0.2
plt.bar([x for x in range(3)],total_y,width=width,label='总分',color='r')
# plt.bar(位置,数据,柱形图的大小,图注)
plt.bar([width+x for x in range(3)],avg_y,width=width,label='平均分',color='g')

plt.xticks([x+width/2 for x in range(3)],x)
plt.xlabel('姓名')
plt.ylabel('分数')
plt.legend()
plt.show()
效果如下


 4079
4079


 被折叠的 条评论
为什么被折叠?
被折叠的 条评论
为什么被折叠?
 到【灌水乐园】发言


