


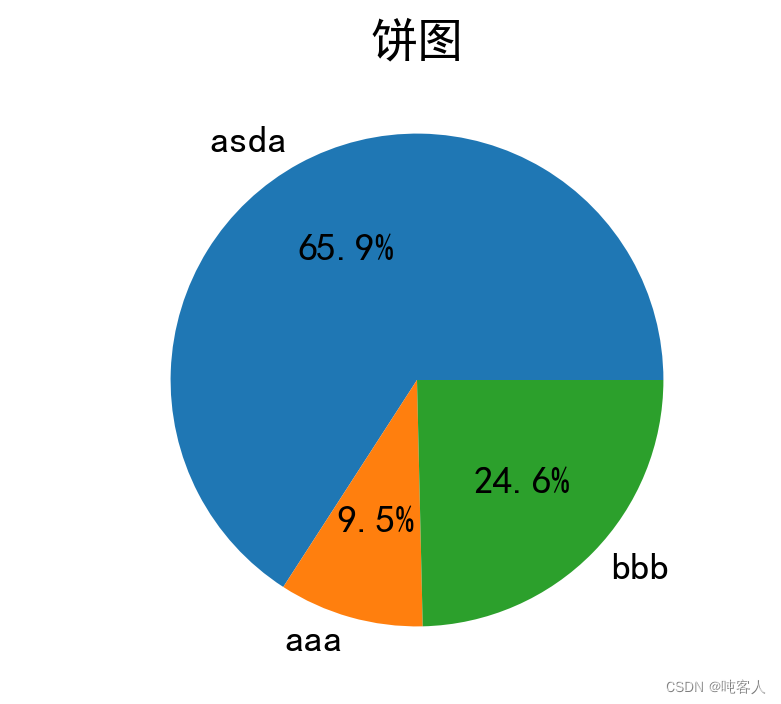
饼图反映了数据的占比,各个数据的占比由系统自动计算。
labels=['asda','aaa','bbb']
plt.figure(figsize=(6,4))#设置画布\n",
plt.pie([np.sum(y1),np.sum(y2),np.sum(y3),],labels=labels,
        autopct='%1.1f%%')
plt.title('饼图')#添加标题\n",
labels=['asda','aaa','bbb']
plt.figure(figsize=(6,4))#设置画布\n",
plt.pie([np.sum(y1),np.sum(y2),np.sum(y3),],
        explode=(0,0,0.1),labels=labels,
        autopct='%1.1f%%',shadow=True)#绘制饼图\n",
plt.title('分离饼图')#添加标题\n"
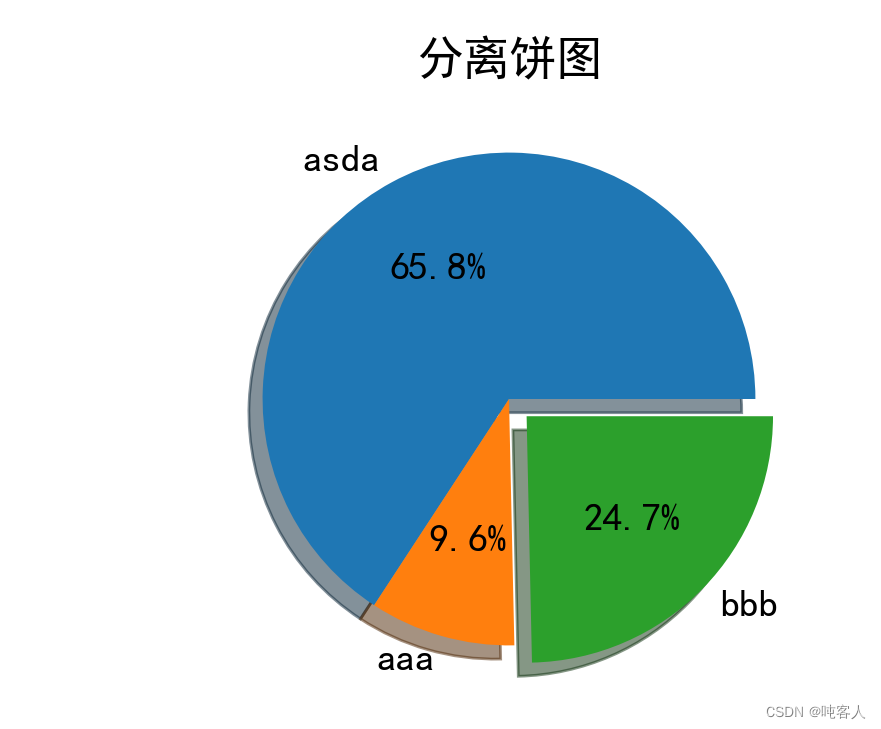
explode参数接受与被绘制的图像参数具有相同数量的元素的元组,元组中 的地n个元素对应被绘制数据系列的第n 个元素,其值表示饼块分离的多少,shadow参数接受布尔值,增加饼图的立体感。


 8万+
8万+


 被折叠的 条评论
为什么被折叠?
被折叠的 条评论
为什么被折叠?
 到【灌水乐园】发言


